Poultry is one of the most widely consumed proteins globally. While poultry has a lower carbon footprint compared to beef (70-80% lower) or lamb (75–80% lower), the scale of production(~70.8 billion chickens were slaughtered globally for meat production in 2020) makes emissions management critical. Moreover, buyers and retailers are increasingly requiring science-based targets (SBTi) to ensure supply chain alignment with climate goals.
Summary
-
Poultry’s massive global consumption is broken into main hotspots like feed production (soy, wheat), manure management, and on-farm energy use, with About 78% of poultry emissions are FLAG, while 22% are non-FLAG.
-
Low-carbon poultry could be both achievable and financially attractive through FLAG and non-FLAG measures around feed and Scope 2.
-
Effective action involves combining feed + land-related strategies, through supplier engagement, long-term offtake agreements, blended finance, and transparent transition plans.
Where Do Poultry Emissions Come From?

Considering a cradle-to-gate boundary, the breakdown of a chicken production company’s value chain highlights clear hotspots:
FLAG (≈77.87%)
Direct land and agricultural activities, up to the farm gate:
- Feed production (≈64.26%) – Soy imports (primarily from the Americas) and wheat, driven by land-use change (deforestation) and fertilizer-related N₂O emissions.
- Manure management (≈13.61%) – Methane (CH₄) and nitrous oxide (N₂O) from chicken litter, a key FLAG emission source.
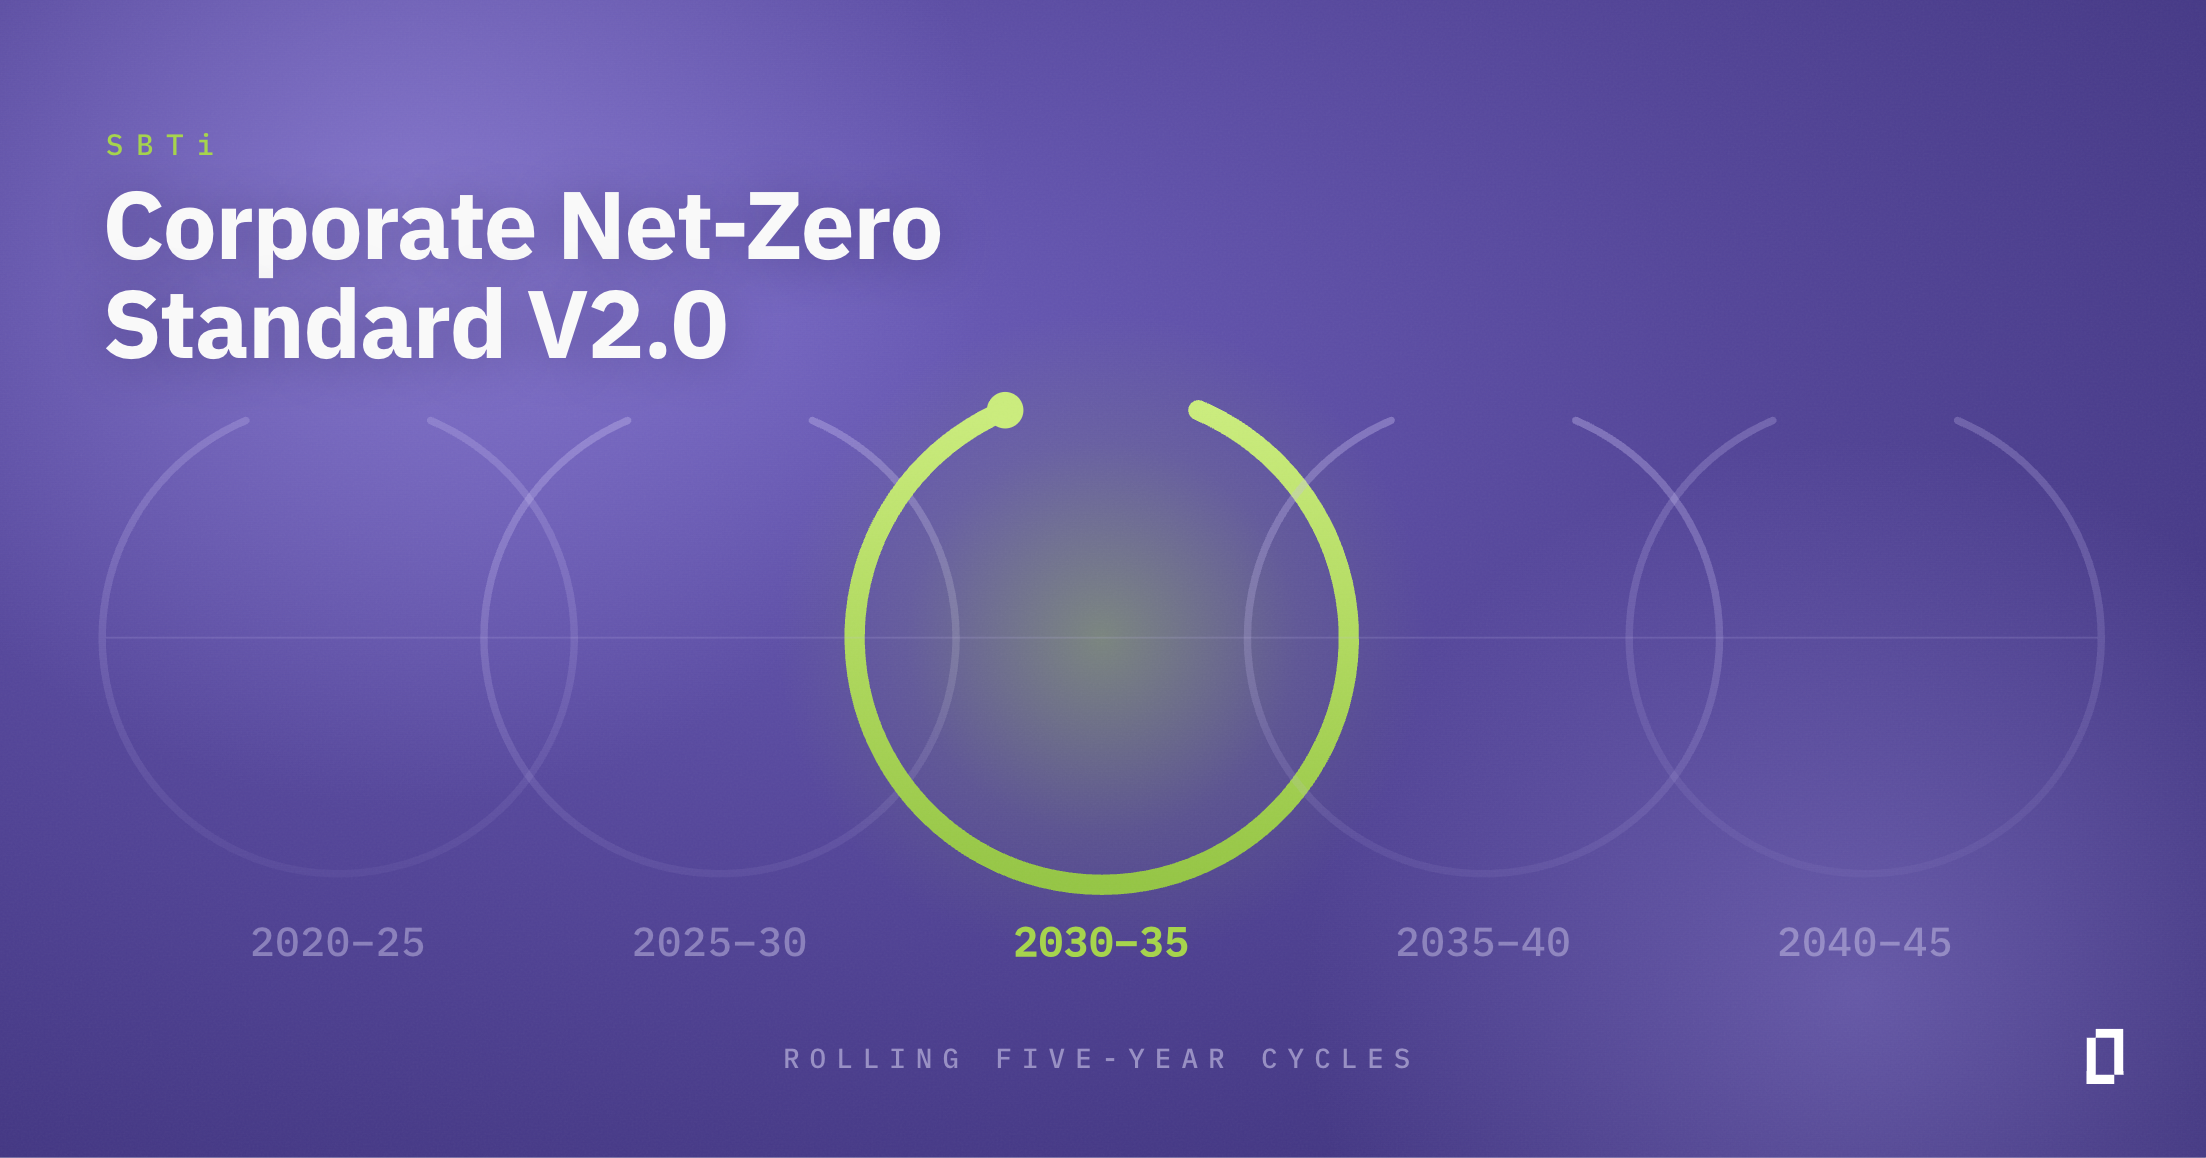
Drafts of the Corporate Standard, Scope 2, and Scope 3 standards will be shared with the public in 2026, with final publication planned for 2027.
Non-FLAG (≈22.08%)
Energy and transport activities beyond land-use:
- Energy use on farms (≈17.05%) – Electricity and fuel for heating and ventilation systems in broiler houses.
- Transport (≈5.03%) – Logistics fuel use, generating CO₂, CH₄, and N₂O.
These emission sources are consistent across poultry and other monogastric livestock such as ducks.
The Business Case for Low-Carbon Chicken
From a business perspective, several of these emission drivers represent financial inefficiencies. Notably, marginal abatement cost curve (MACC) analyses indicate that several poultry decarbonization levers already deliver positive returns.
Feed, for instance, comprises up to 70 percent of a poultry producer’s operating costs. Efficiency gains in this area will thus have an outsized financial impact. Interventions such as precision feed management or substituting deforestation-linked soy with alternatives like peas or rapeseed not only cut emissions intensity but also lower feed expenditure.
Energy efficiency upgrades and rooftop solar systems reduce Scope 2 emissions while decreasing utility bills. Even capital-intensive solutions like anaerobic digesters offer long-term financial value when tied to renewable energy credits or revenue from biogas and electricity sales. Studies suggest digesters can lower poultry methane emissions by as much as 40-60%.
Several major poultry companies, like Scandi Standard, have also had the confidence to align with the Science Based Targets initiative (SBTi), with near- and long-term FLAG targets and published transition plan–style disclosures.
Scandi Standard’s plan combines:
- Scope 2 initiatives around energy efficiency, renewables, electrification
- Feed-focused Scope 3 action around deforestation-free soy,
local protein trials & farmer engagement - Wider innovations in packaging, low-emission transport & alternative proteins
Their financing model, built around long-term offtake agreements, supplier engagement platforms, and blended finance, is helping lower the cost of transition, while improving data transparency and value chain resilience.
Early movers in low-carbon poultry can position chicken as a “climate-conscious” alternative – capturing premium markets, strengthening brand reputation, and meeting the growing demand from retailers and consumers for climate-smart food options.
Bridging the Gaps in Decarbonizing Poultry
Using a mitigation hierarchy (avoid > reduce > substitute > remove > offset), several strategies emerge:
FLAG Decarbonization Levers
- Sourcing deforestation-free feed: Soy, a common ingredient of chicken feed, can be the largest driver of poultry emissions owing to deforestation. Combining responsible sourcing with supplier-specific emissions data for direct land-use change calculations can significantly reduce upstream impacts.
- Sustainable feed substitution: Replacing soy with lower-emission crops such as rapeseed, peas, or beans can diversify protein sources and reduce land-related emissions.
- Precision agriculture and fertilizer management: Optimizing fertilizer use, improving manure management, and adopting enhanced-efficiency fertilizers cut nitrous oxide emissions, while boosting yields and reducing input costs.
- Manure management: Anaerobic digesters capture methane from manure, converting it into renewable biogas and producing organic fertilizer cutting emissions while creating additional value.
Non-FLAG Decarbonization Levers
- Energy efficiency and renewables: Upgrading to energy-efficient HVAC systems, alongside renewables investment cuts energy demand and strengthens on-farm energy resilience.
- Downstream innovations: Repurposing slaughterhouse byproducts, transitioning fleets to electric / hybrid vehicles, and adopting low-GWP refrigerants can reduce emissions across operations.
For chicken producers pursuing SBTi validation, the SBTi FLAG framework requires them to reduce emissions intensity by ~3.9% annually (tCO₂e per ton fresh weight) from 2020 to 2030, for FLAG emissions only. Chicken is one of the 11 FLAG commodity pathways, and undergoes more scrutiny beyond the existing requirements for baseline validation.
However, as poultry emissions are so heavily tied to feed and land use, the SBTi recommends broader land-sector strategies. Practices such as reduced tillage, cover cropping, and crop–livestock integration have been shown to sequester between 0.3 – 1.0 tCO₂e per hectare per year, depending on local conditions.
Depending on context, agroforestry systems, integrating trees into croplands and pastures, can store biogenic carbon up to 1 - 2 tCO₂e per hectare annually. This also improves biodiversity and resilience to climate extremes.
In parallel, demand-side shifts further reduce pressure on land. Measures such as lowering food loss and waste, promoting more efficient feed-to-protein conversion, and encouraging dietary diversification at the system level help moderate growth in poultry demand while improving overall resource efficiency.
Together, these approaches support long-term, system-wide decarbonization to meet the FLAG trajectory beyond short-term interventions.
The Road Ahead
Decarbonizing poultry is an opportunity to build resilient supply chains, access premium markets, and strengthen consumer trust in a carbon-conscious economy. The solutions already exist, including sustainable feed sourcing, feed substitution, precision agriculture, cost-effective renewable energy, and supplier engagement platforms. The next step is bold execution and innovative financing to turn these pathways into measurable impact.
As the poultry sector evolves, the upcoming Land Sector and Removals Guidance (LSRG) from the GHG Protocol will redefine how companies report on land-use change, insetting, and carbon removals. This will significantly impact emissions accounting across agriculture, retail, food and beverage, and consumer goods sectors, of which poultry will be a part. Producers that engage early will be better positioned to navigate compliance risks, avoid greenwashing, and deliver credible climate strategies into 2025 and beyond.
For those looking to understand these shifts in detail, I highly recommend you catch my colleague, Ben Putman’s latest webinar, From Accounting to Insetting, which covers the coming LSRG changes, their implications for Scope 3 disclosures, and how to prepare for a more rigorous, land-linked emissions reporting landscape.