Summary
-
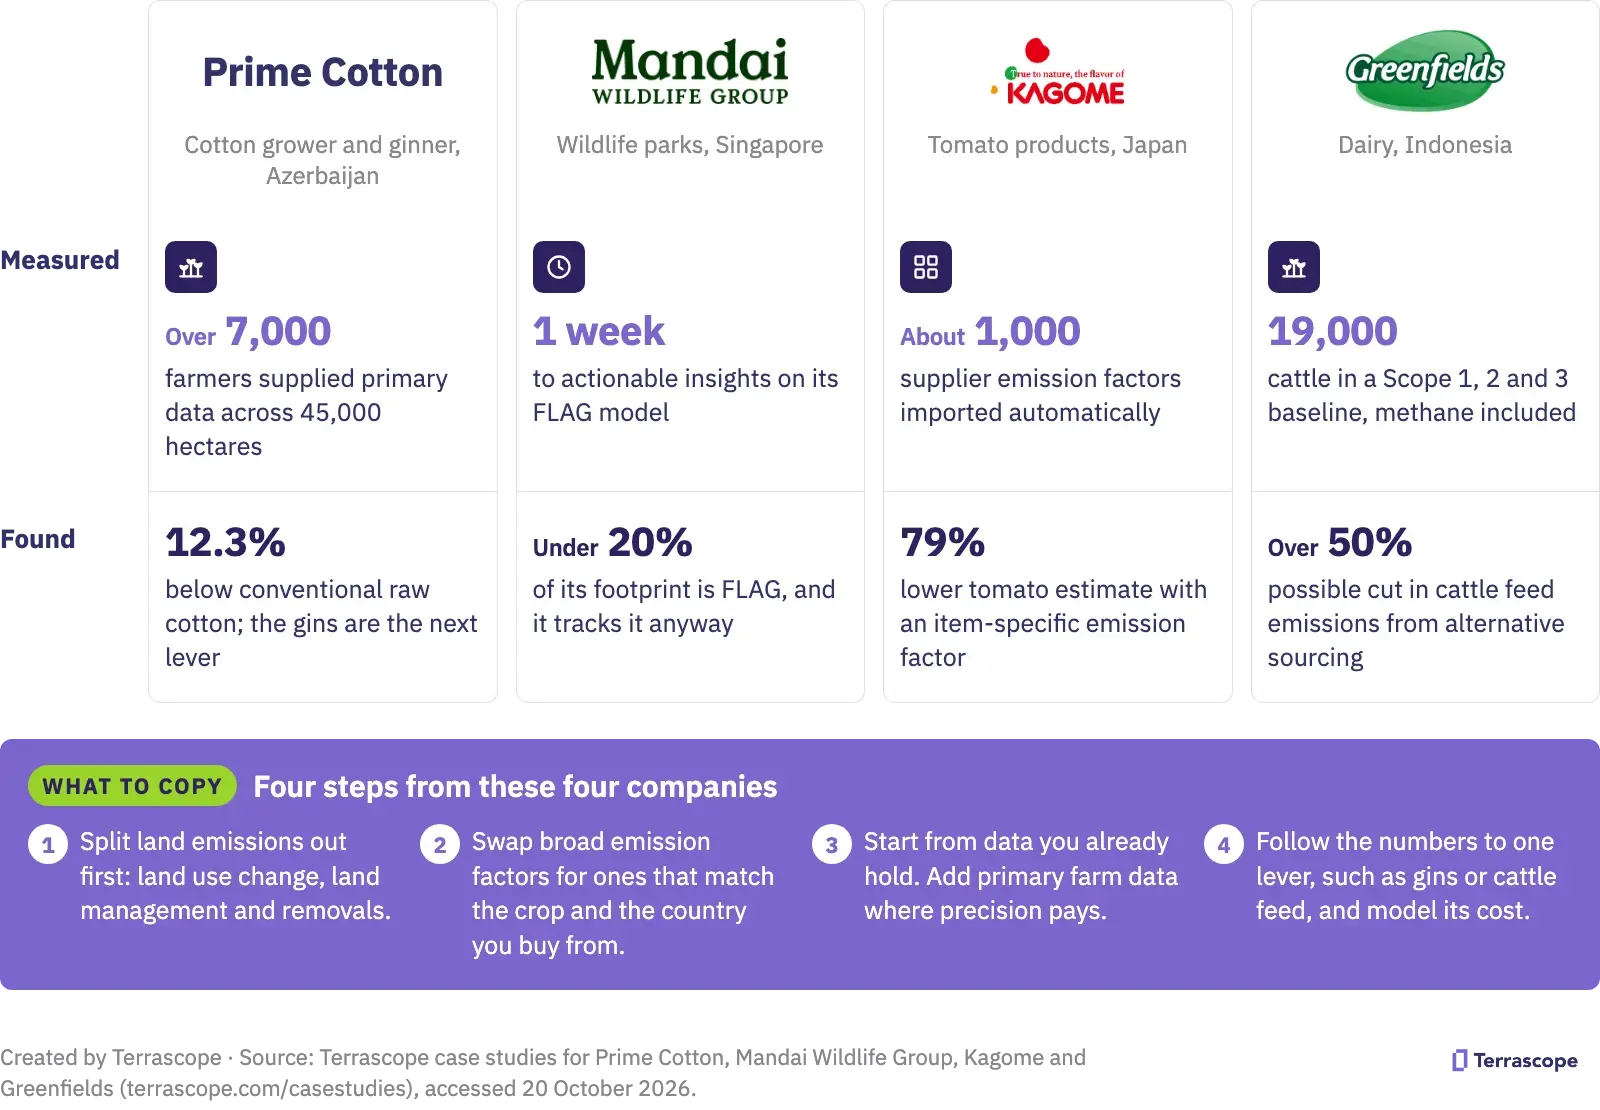
Farm-level data shows where to cut. Prime Cotton’s raw cotton came in 12.3% below conventional cotton, but only 0.5% below at the fibre stage, which pointed to its gins.
-
Broad emission factors can misstate land emissions. Switching to an item-specific emission factor reduced Kagome’s estimate for field-grown tomatoes by 79%.
-
Land-exposed companies are applying the FLAG reporting format even if the SBTi doesn't require a target. Mandai’s FLAG emissions are under 20% of its footprint, and an independent review gave it actionable insights within one week.
-
Land data now supports sales. Prime Cotton’s buyers can use its custom emission factor in their own Scope 3 calculations, and Kagome’s more precise data backs its sustainability credentials as it expands overseas.
If land drives your footprint, the Science Based Targets initiative (SBTi) requires a FLAG (Forest, Land and Agriculture) target separate from Energy & Industry emissions. The GHG Protocol’s Land Sector and Removals (LSR) Standard takes effect on 1 January 2027 and, for in-scope companies, requires reporting land use change, land management and removals separately. Most of those emissions happen on farms that many companies don’t own. Your emission factors describe “processed food” or a whole region, not the crop you buy or where it grows.
These four land-intensive companies faced the same gap. Each one measured the emissions from its land and farms, using data it already held or collected from growers, found what drove them, and saw where to act first.
The four at a glance
Which example matches your situation?
- Crops from thousands of contract growers → Prime Cotton
- FLAG below 20% of your footprint, but likely to grow →Mandai
- An SBTi validation to update with FLAG targets → Kagome
- Broad or regional emission factors that don’t match what you buy → Kagome and Mandai
- Livestock and methane in your footprint → Greenfields
How Prime Cotton measured 45,000 hectares
Result: raw cotton at 0.873 kg CO2e per kilogram, 12.3% below conventional raw cotton, measured with primary data from more than 7,000 farmers.
Business outcome: Prime Cotton can now show buyers a product carbon footprint for its cotton, and textile and apparel companies can use its custom emission factor in their own Scope 3 calculations. The work took 75% less time than a traditional life cycle assessment, and Prime Cotton can now measure its footprint every year without the cost of inaccurate yearly assessments.
Prime Cotton grows and gins cotton in Azerbaijan for customers up to and including high street fashion brands.
- The problem: its 45,000 hectares include 5,000 it manages and about 40,000 farmed by 7,000 contracted growers, feeding 11 cotton gins. The farms also grow barley and wheat, so fertiliser and other inputs had to be shared out between crops. Each gin turns raw cotton into fibre, seed and by-products, so emissions had to be shared out again. The data arrived in several formats and languages.
- What Terrascope did: collected primary data from the growers (farm inputs, field boundaries, tractor fuel and irrigation electricity), matched emission factors with AI models and calculated a product carbon footprint from field to gin. It then benchmarked the results against global averages.
- What it found: land use change emissions are below average, because a large share of the growers’ farms have been in production for over 20 years. At the fibre stage the advantage shrinks to 0.5%. Prime Cotton uses 2.37 kg of raw cotton per kilogram of fibre, against a global average of 2.08 kg, and the electricity and gas in its gins carry a higher emission intensity. That points to the gins for the next cut.
- Quality check: the case study describes the method as auditable, on a platform certified to the GHG Protocol, ISO 14064 and ISO 27001:2022.
Read the Prime Cotton case study
How Mandai sharpened its FLAG model
Result: actionable insights to improve the accuracy of its FLAG emissions within one week of the project starting.
Business outcome: Mandai is now positioned to disclose FLAG emissions with confidence and to prepare for SBTi FLAG target validation. Once in place, Terrascope’s recommendations are set to reduce the sustainability team’s manual workload and flag high-risk commodities faster.
Mandai Wildlife Group runs Singapore Zoo, Night Safari, River Wonders and other wildlife parks in Singapore.
- The problem: construction makes up most of Mandai’s footprint, so FLAG emissions, mostly from the food it buys, are less than 20% of the total. That is below the point where the SBTi requires a FLAG target. Mandai built its own FLAG method and tracks the emissions anyway, because their share could grow as construction winds down.
- What Terrascope did: reviewed Mandai’s method against the SBTi FLAG criteria and the GHG Protocol’s LSR Guidance, checked every emission factor and assumption against peer-reviewed datasets, and compared Mandai’s figures with country- and commodity-specific data from ecoinvent, a widely used life cycle database.
- What it found: the model applied land use change emissions by broad region, which could over- or understate them as sourcing changed. Terrascope recommended country- and commodity-specific assumptions for higher-risk items such as beef, poultry and coffee, tagging emission factors so the FLAG split runs automatically, and sharing land use change across co-products such as soy oil and soy husk.
- Quality check: the review was independent and aligned with the LSR Guidance and SBTi FLAG criteria. Mandai’s approach had already received positive feedback from external reviewers, including the SBTi.
“Terrascope provided the expert review and actionable insights we needed to improve our FLAG emissions accounting in just a matter of weeks.”
Ou Guojian, Deputy Vice President, Sustainable Solutions, Mandai Wildlife Group
How Kagome measured FLAG from data it already held
Result: a field-grown tomato estimate 79% lower than before, and FLAG emissions measured from data Kagome already held.
Business outcome: Kagome set reduction targets in line with the SBTi’s FLAG guidance and updated its SBTi validation. More precise Scope 3 data now lets it rank reduction efforts by quantitative analysis, and backs its sustainability credentials as a food manufacturer expanding overseas.
Kagome, based in Aichi Prefecture, Japan, makes tomato and vegetable products such as ketchup and juices. It runs everything from farming to processing and sales in-house, with 3,000 employees and 43 factories worldwide.
- The problem: its domestic emission factor databases offered broad categories such as “processed food” or “seasonings”, not tomato paste or concentrated fruit juice. Its team handled about 1,000 supplier-specific emission factors by hand, in tools that didn’t work together. To update its SBTi validation, Kagome also had to measure FLAG emissions, but lacked the in-house expertise and systems to do it.
- What Terrascope did: switched Kagome to item-specific emission factors from global databases and imported those supplier emission factors automatically. It then split out FLAG emissions from existing data without changing the emission factors, covering land use change and chemical fertilisers, and supported Kagome through the SBTi documentation and questions.
- What it found: FLAG emissions came to 31.34% of total Scope 1–3 emissions. More precise data on purchased goods and services (Scope 3 Category 1) showed where emissions sit across its food value chain.
- Quality check: Kagome’s updated SBTi validation includes FLAG, with targets set in line with the SBTi’s FLAG guidance.
“Terrascope’s expert advisory support was incredibly reassuring during the FLAG measurement and SBT validation update. By leveraging existing data, we were able to execute the FLAG assessment efficiently and smoothly.”
Harunobu Okutani, Director and Managing Executive Officer, Kagome
How Greenfields traced its dairy emissions to cattle feed
Result: alternative sourcing could cut cattle feed emissions by more than 50%.
Business outcome: A marginal abatement cost curve (MACC) analysis showed that procurement choices could also cut costs, such as replacing 10% of one type of cattle feed with an alternative. Greenfields now has the data and analytics to engage employees and stakeholders on emissions reductions.
Greenfields, one of Southeast Asia’s largest dairy companies, runs farms with 19,000 cattle in Indonesia and a factory making fresh and UHT milk, cheese, yoghurt and drinks.
- The problem: leadership wanted to engage internal and external stakeholders on sustainability, but lacked the data to do it, with regulations and reporting obligations still seeming distant. Benchmarking, hotspots and cost analysis all depended on a full Scope 3 baseline it didn’t yet have.
- What Terrascope did: working with Greenfields and its investor TPG Capital, built a Scope 1, 2 and 3 baseline, methane included, from feed through farms and factory to distribution. Greenfields then used the platform to model cuts across feed procurement, enteric fermentation (the methane cattle produce as they digest), manure and transport, and ran the MACC analysis to compare their cost.
- What it found: feed procurement was the lever that could cut emissions and costs together, a reduction opportunity Greenfields had not known about.
- Quality check: Greenfields benchmarked its dairy emissions profile and intensity against local and global competitors and non-dairy alternatives.
Read the Greenfields case study
Measure your land emissions in weeks
Terrascope pairs the platform with climate and carbon experts who work with your team from farm data to FLAG targets and assurance.
- FLAG and LSR: SBTi FLAG targets and reporting under the LSR Standard
- Agriculture: carbon measurement for land-based supply chains
- Product Carbon Footprint: a footprint and custom emission factor for each crop or product
- Corporate Carbon Footprint: Scope 1, 2 and 3, methane included, in one inventory
Further reading
- How food and beverage companies cut emissions: 5 examples
- Does the Land Sector and Removals Standard apply to your company?
- 7 things you need to know about reporting land emissions with imperfect data
- Forest, Land and Agriculture (FLAG): what it is and how companies can get started
- Best agri-food carbon accounting platforms compared
FAQs
Sources: Terrascope case studies for Prime Cotton, Mandai Wildlife Group, Kagome and Greenfields (terrascope.com/casestudies, accessed 20 October 2026). GHG Protocol, Land Sector and Removals Standard v1.1.