Skip to content


One platform for your emissions, energy, water and waste metrics.

Three dashboards built on the same data foundation as your carbon. 


Overview-water-dashboard

Expand beyond carbon
with energy, water & waste

Emissions data in a platform. Energy, water and waste metrics still in spreadsheets? 


Terrascope data collection campaign card for a water and waste demo using GRI-aligned templates

Water and waste data using the same Data Campaigns workflow

The same Data Campaign workflow your team already runs for emissions can also bring water and waste into the platform. Standard templates for utility bills, water meter readings, and waste manifests. Custom templates for site-specific formats. PDF extraction available for supplier invoices.


Terrascope water and waste activity data table with measurement records by category, type and location

Review files and make corrections in the platform

Review uploaded data side-by-side with the source file inside the platform. Flag variances. Fix entries before the number is reflected on the dashboard. The validation workflow you already use for emissions activity data extends to energy, water and waste, and corrections are logged as part of the standard audit trail.


Terrascope waste dashboard showing total waste generated by year, disposal status and management method

Waste, by site, treatment method, and year on year

Track waste volume and treatment method across every site in your operation. Filter by business unit, fiscal year, or location. Compare to the same period last year. 

Terrascope water dashboard tracking total water consumption with withdrawal by year and source destination

Water withdrawal and consumption, by site, business unit, and source

Site-level water withdrawal and consumption. Source breakdown — third-party/municipal, ground/bore, surface/harvested. Year-on-year variance built in. Filter by division, business segment, fiscal year, water use, and location. 


scope-2-energy-consumption-dashboard

Energy consumption, by type, by site, year on year

Track total energy consumption across your operations, broken down by source: grid electricity,
on-site renewable generation, and other energy types your sites use. Year-on-year comparison
of the energy mix. Filter by site, business unit, fiscal year, or location. 


Frequently Asked Questions


What's included in Terrascope's energy, water and waste capabilities?

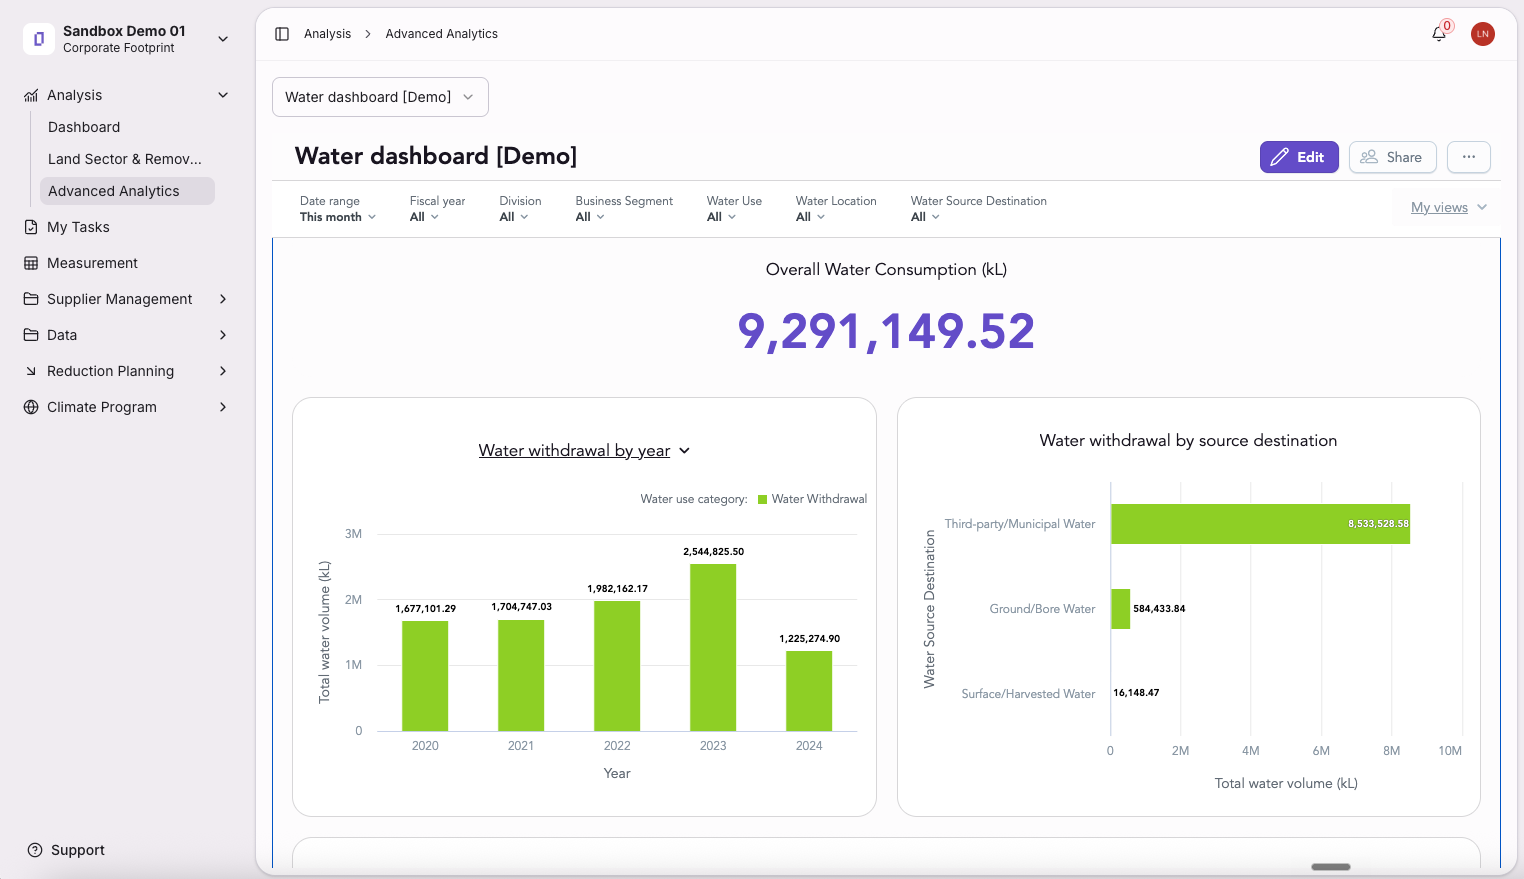
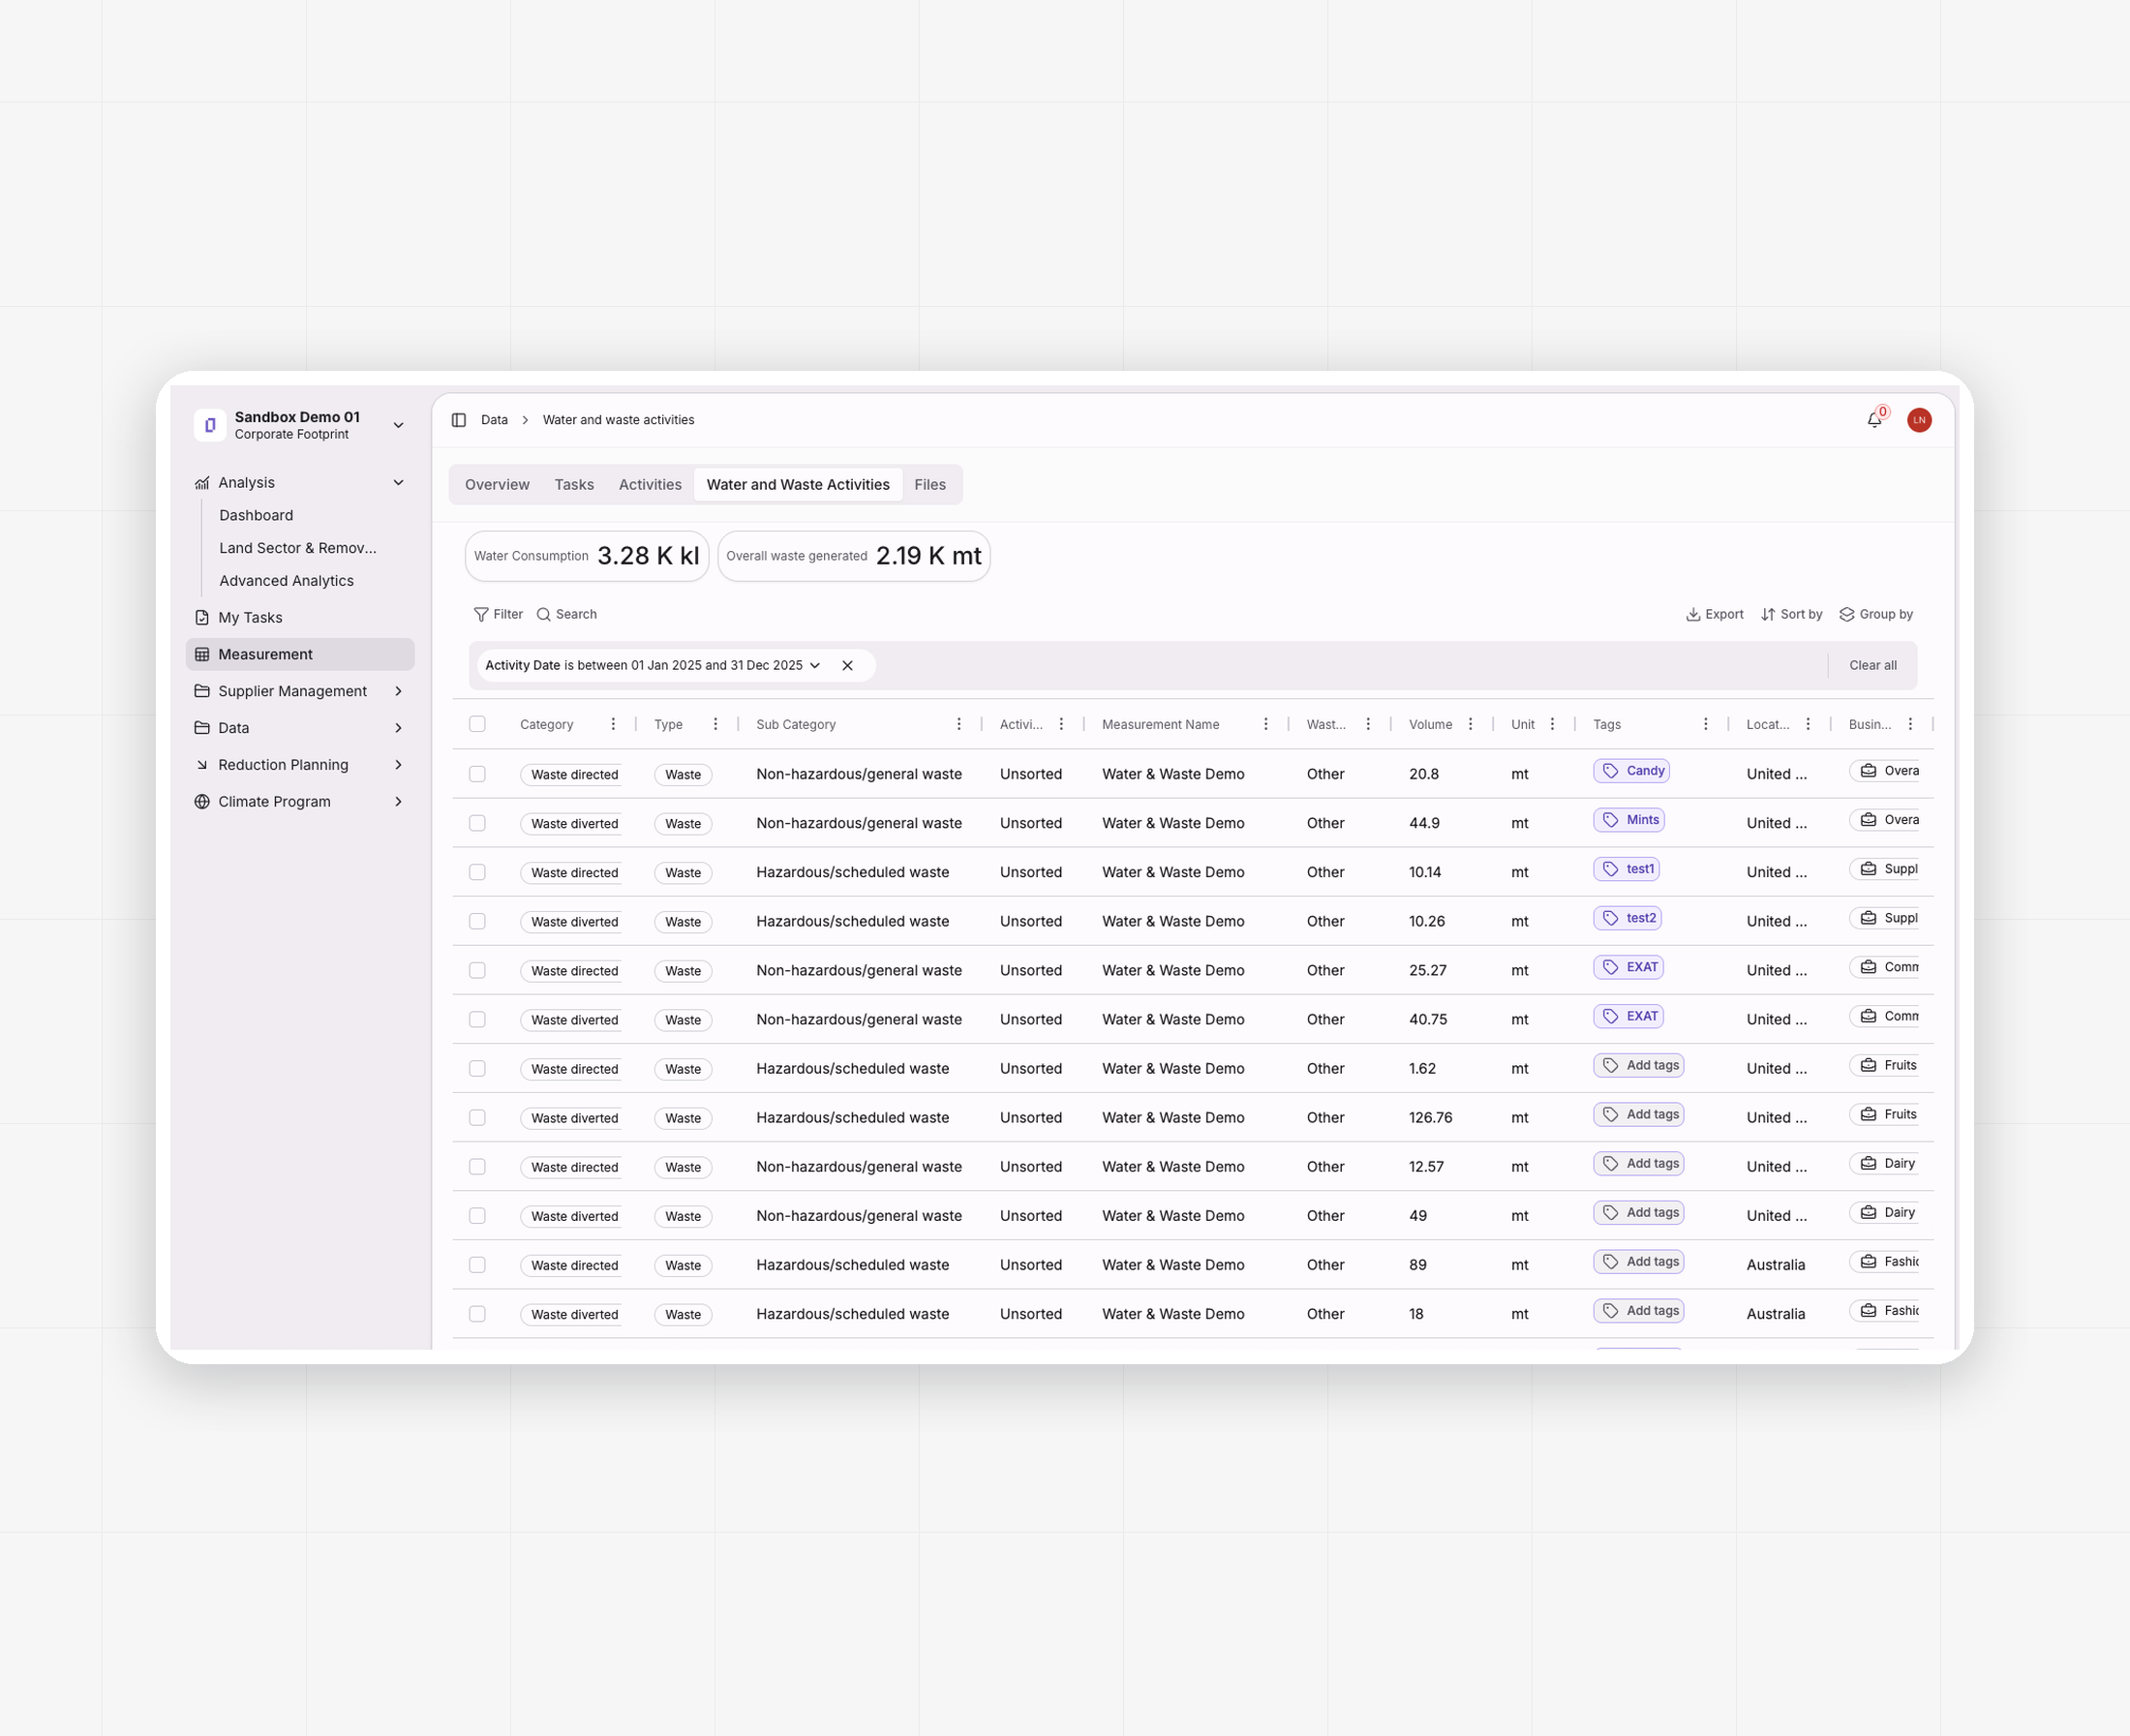
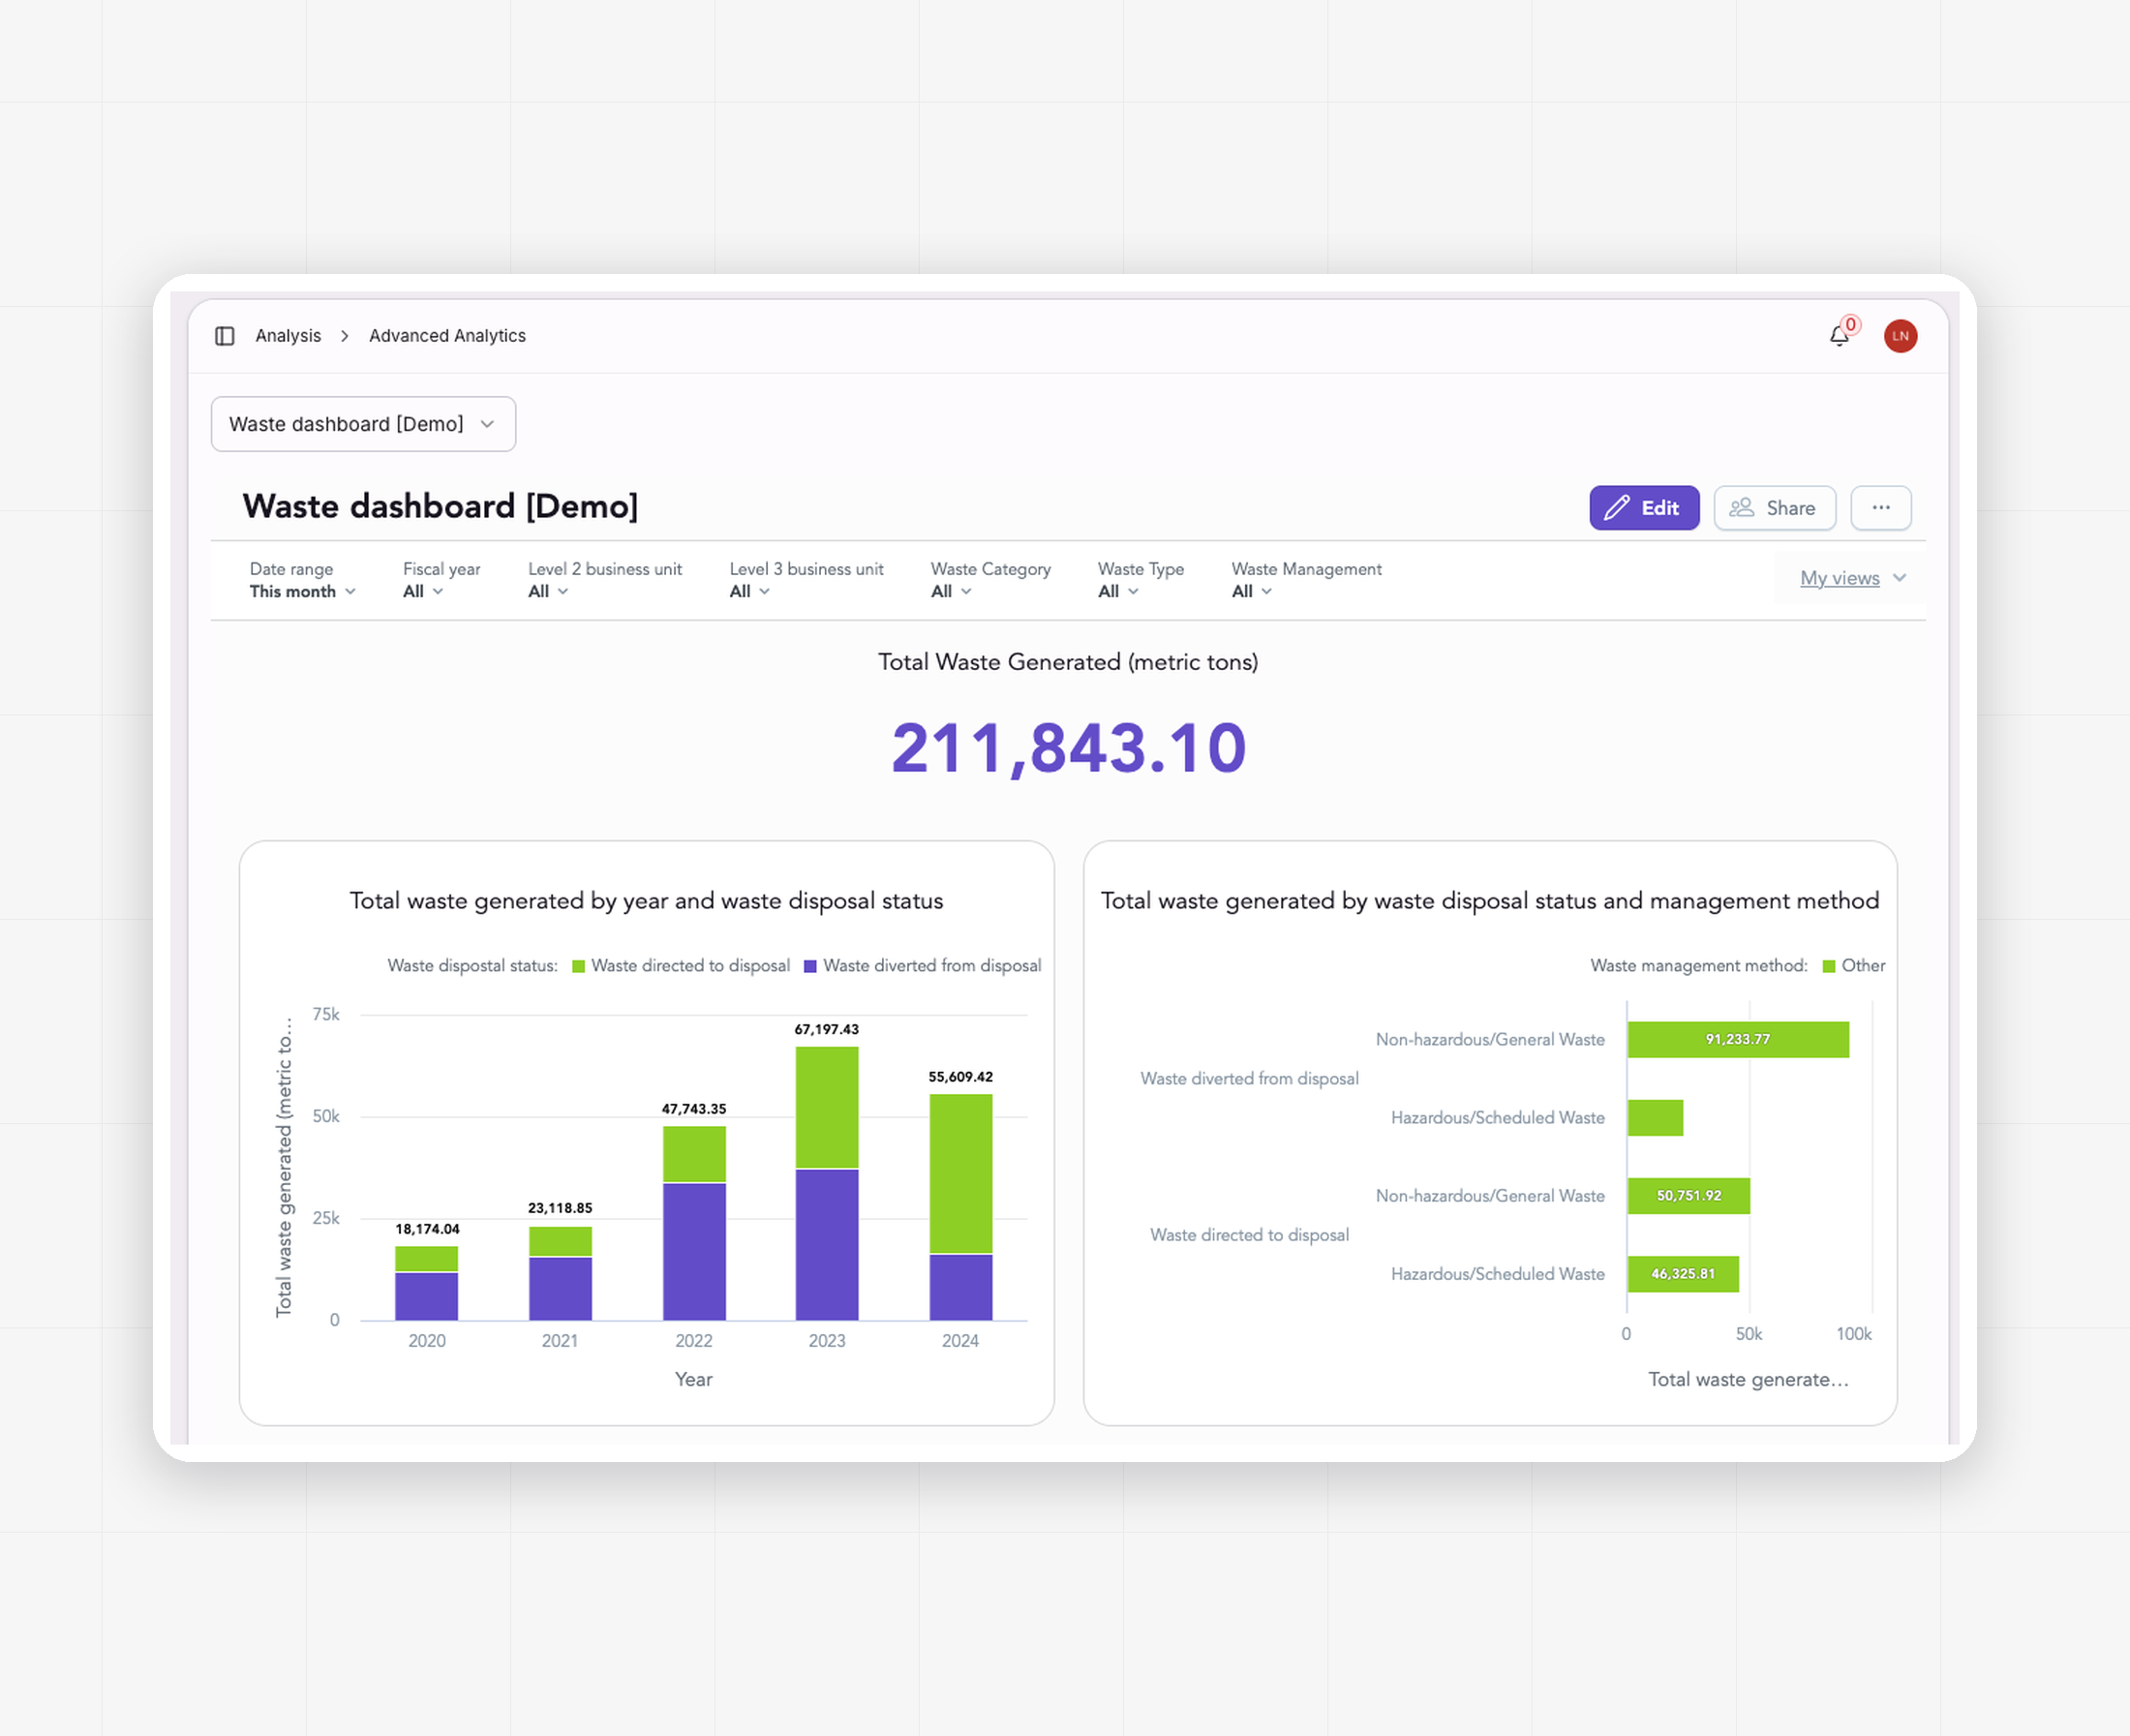
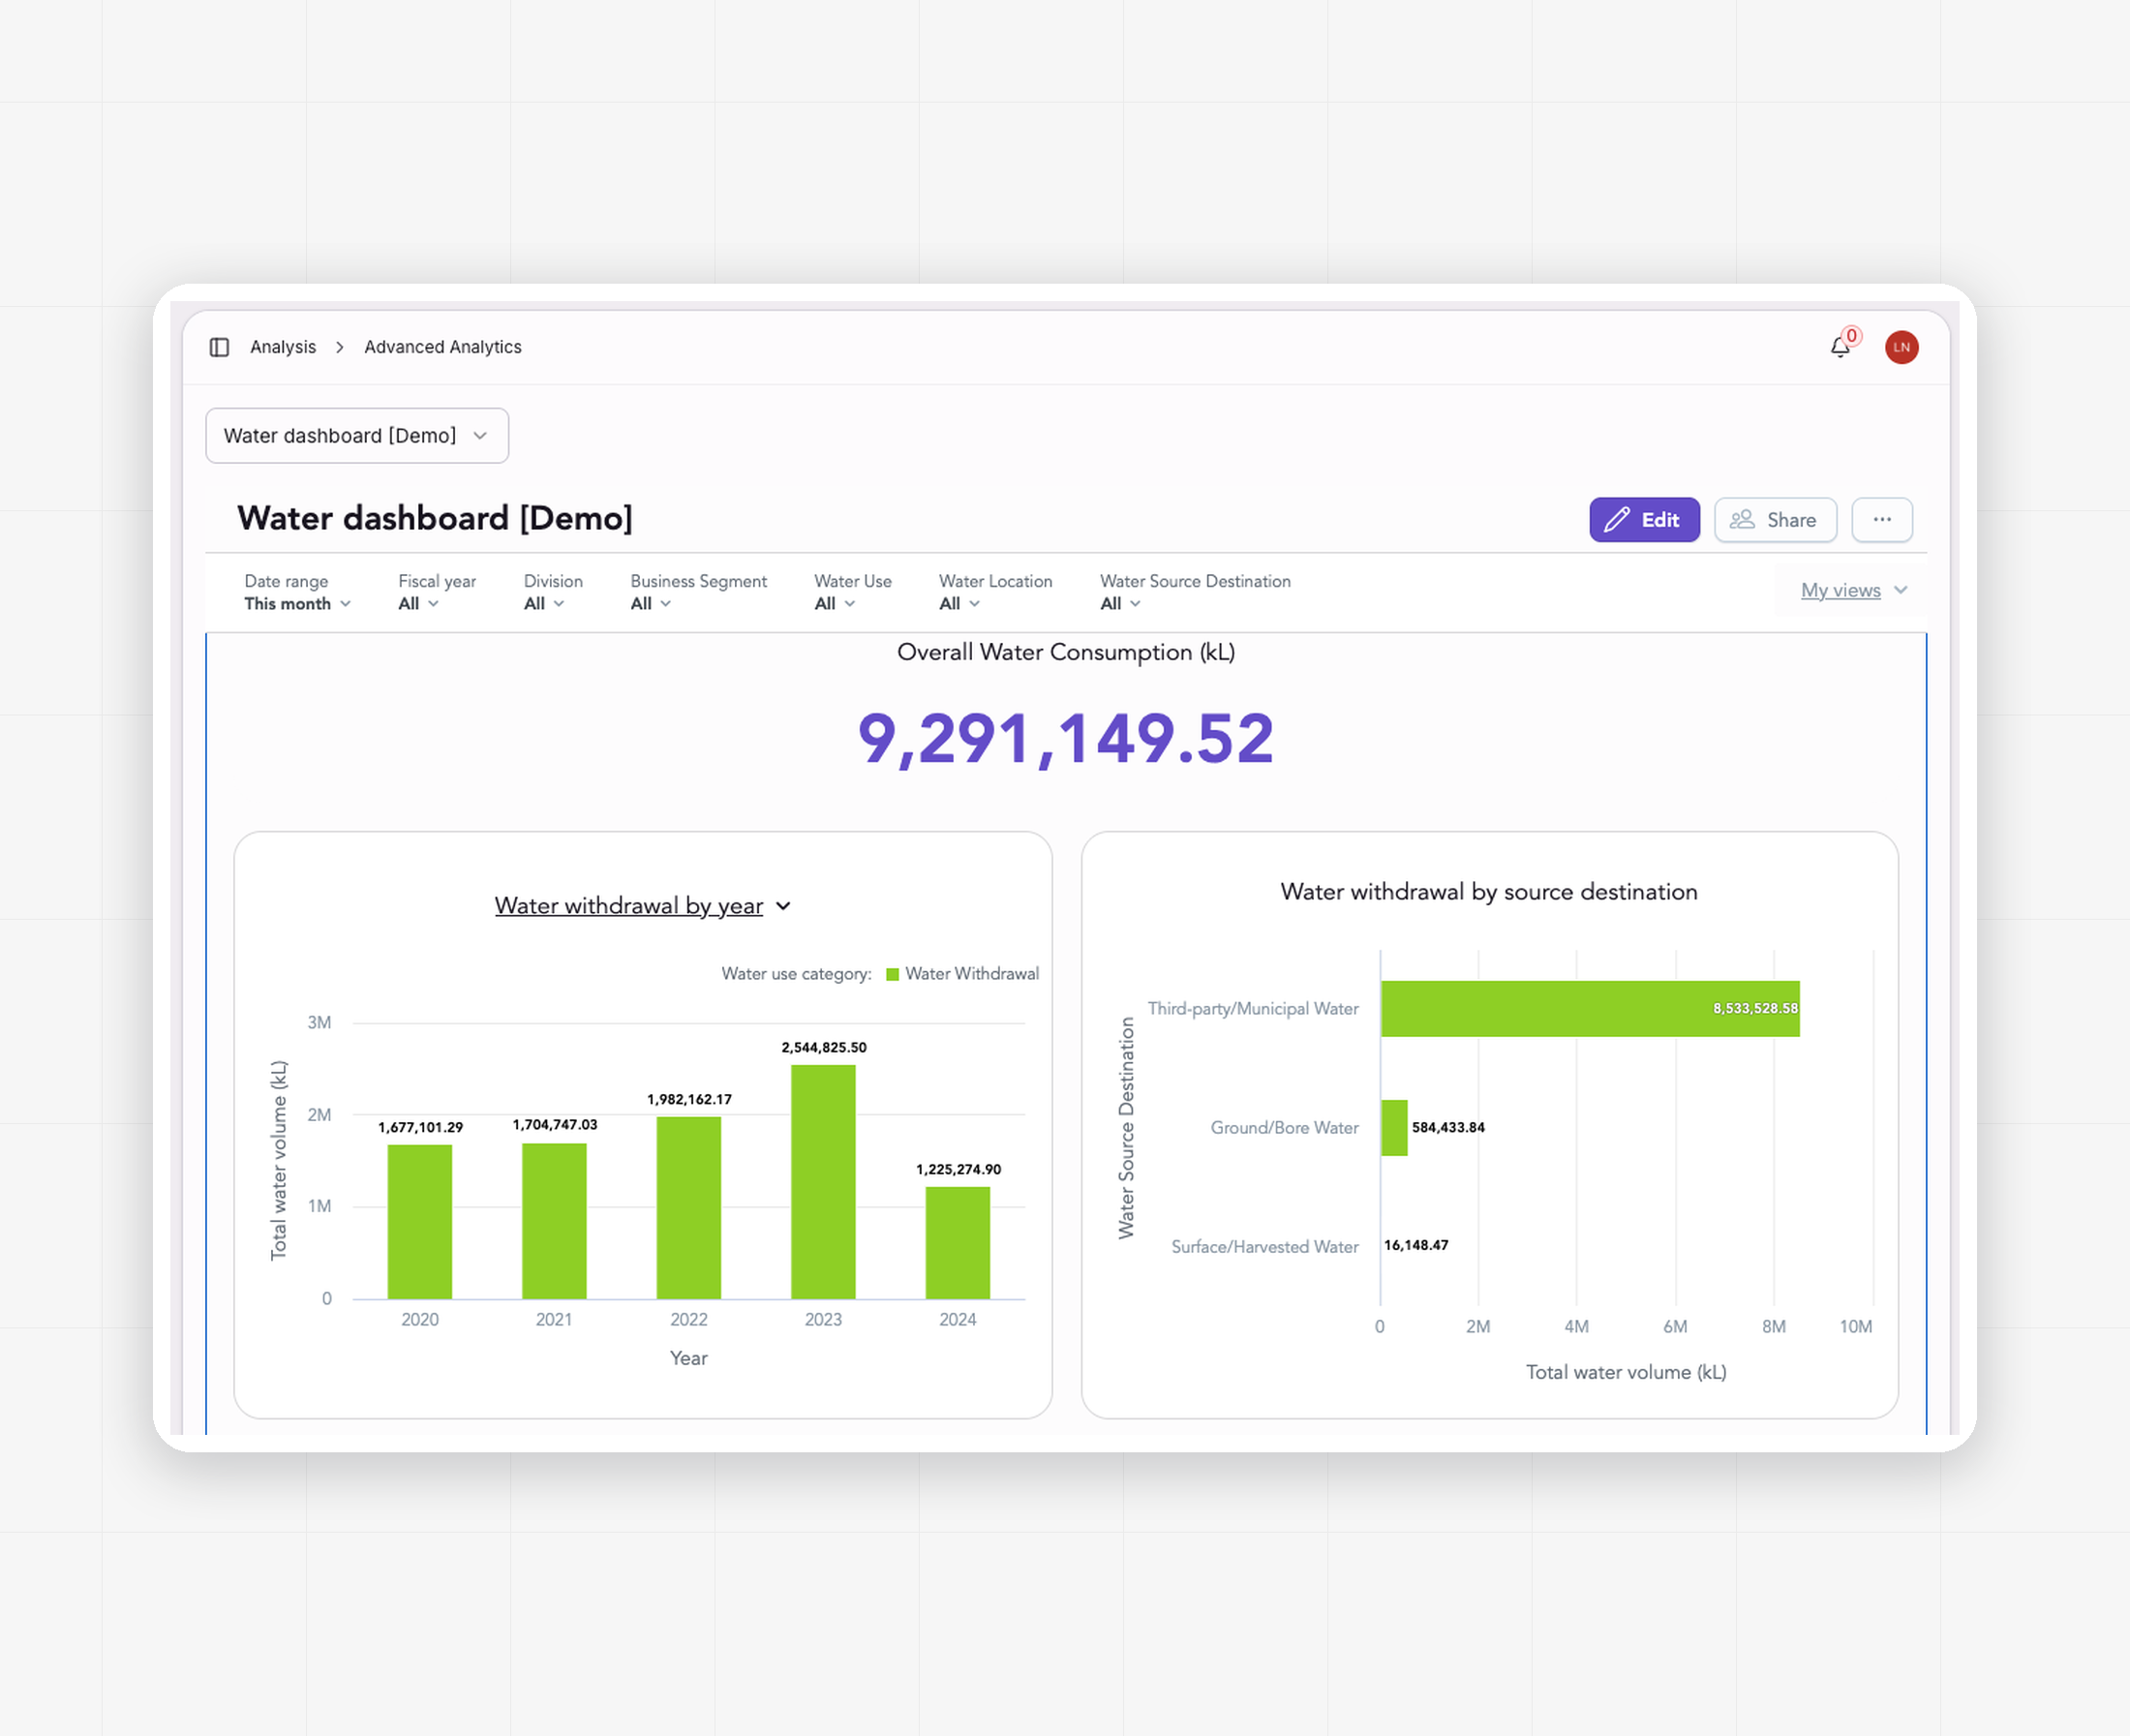
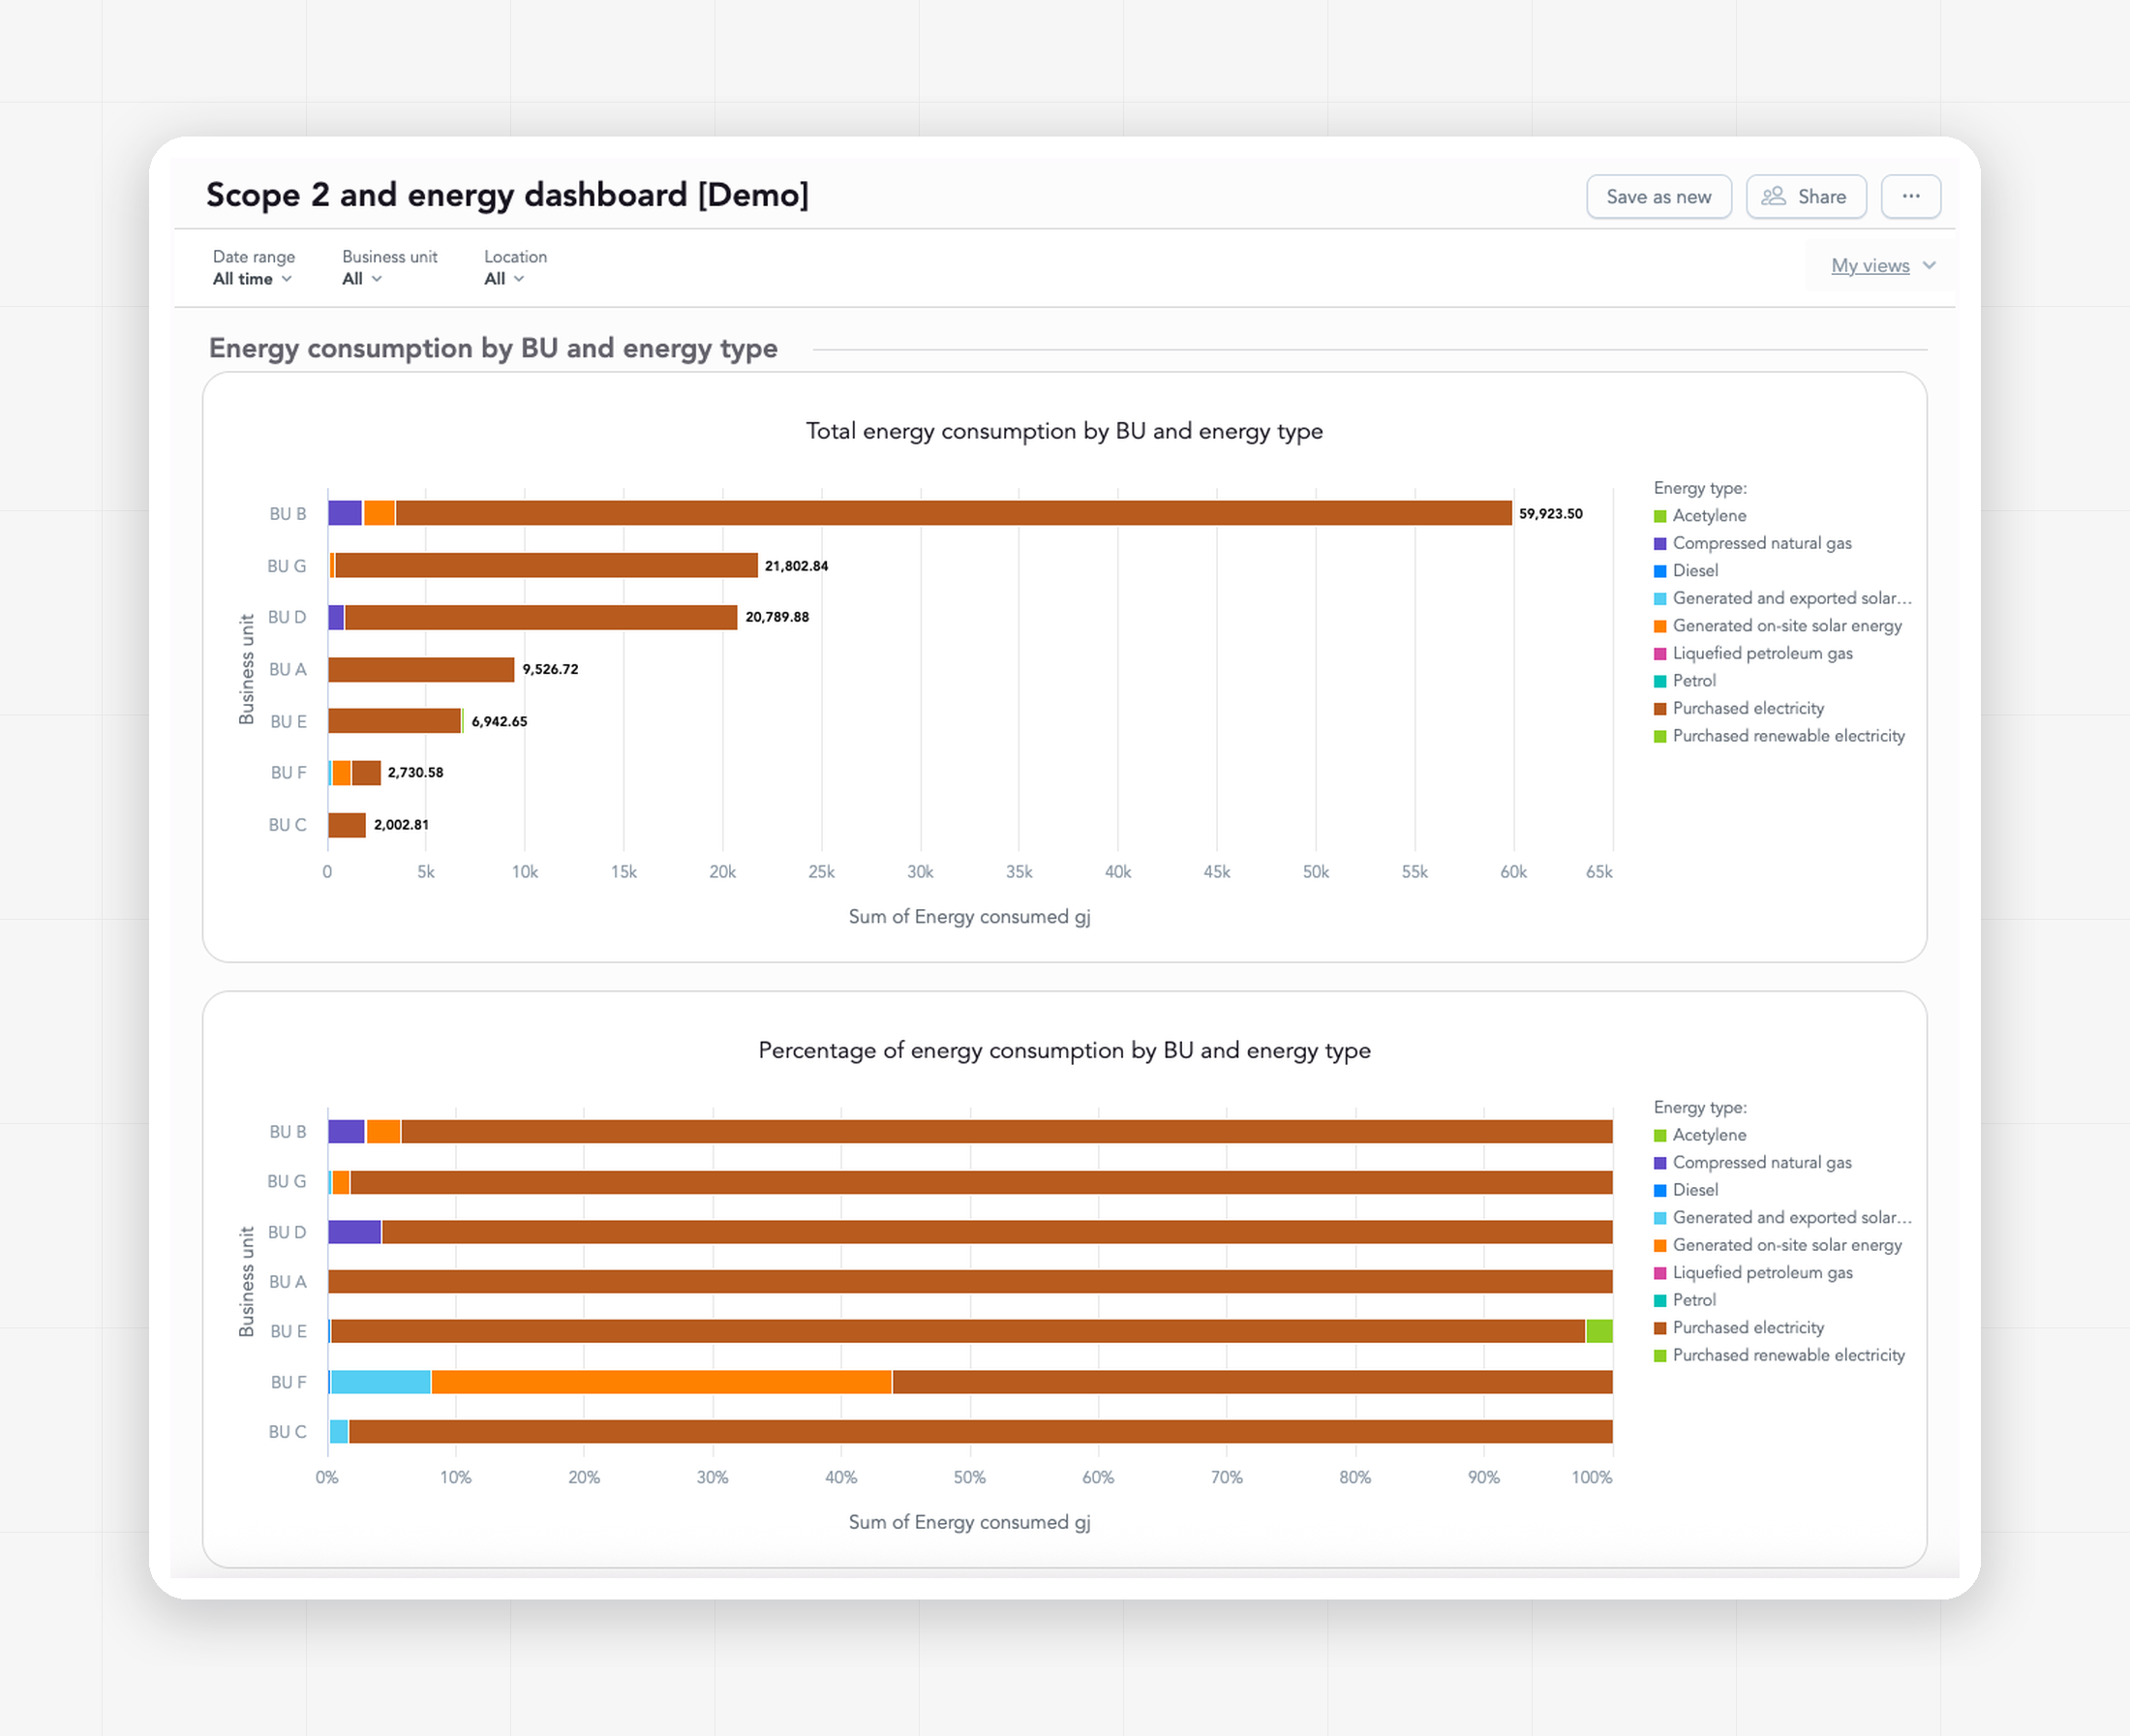
Three dashboards inside the Terrascope platform: Waste, Water, and Scope 2 & Energy. Each is fed by the same Data Campaign workflow as your emissions activity data, with year-on-year variance, business-unit and site-level filtering, and self-serve export for auditor review.

How is this different from the Climate Reporting module?

Climate Reporting is the AI-drafted disclosure builder for IFRS S2 and the standards built on it (ASRS, UK SDS, SSBJ, CUE). It produces a formal climate disclosure pack. Energy, Water & Waste is the underlying measurement and visualisation layer for non-climate environmental data. The two are complementary. Energy, Water & Waste data can feed into any external report, including the broader sustainability disclosure work many organisations are now scoping alongside their climate reporting. See Climate Reporting here.

Does this require the full Terrascope platform?

The Energy, Water & Waste dashboards are part of the Terrascope platform. The same data ingestion, emission factor management, and audit trail used for carbon are used here. Customers already running Scope 1, 2 and 3 measurement on Terrascope can add the Energy, Water & Waste dashboards on the same data foundation.

Can my auditor see the data?

Yes. Auditors receive viewer seats inside the platform, the same access model used for emissions data. They see the activity data and the full lineage from source file to dashboard number.

How does the energy, water and waste data get into the platform?

The same way emissions activity data does, through the Data Campaign workflow. Data can be uploaded via standard templates, custom templates, or extracted from supplier invoices, utility bills, and waste-management reports. The data is validated against standard rules (units, source classifications, treatment methods, site assignments). Water volume and waste volume are reported directly as the metric. No EF conversion needed. Every record carries full lineage from source file to dashboard number.

Can Terrascope track environmental or sustainability metrics beyond energy, water and waste?

Yes. The three dashboards are the standard set, but Terrascope's Advanced Analytics feature builds custom dashboards on top of your data. Customers have used it for renewable-energy progression by site, supplier emission hotspots, custom sustainability KPIs, and other metric views specific to their reporting framework or board needs. If you have a metric or data collection workflow that isn't covered by the three standard dashboards, talk to us about scoping it through Advanced Analytics.

How does this support broader sustainability reporting beyond climate?

Energy, water and waste are foundational environmental metrics that appear in most sustainability disclosure frameworks. The Terrascope dashboards bring these metrics into the same audit trail as your carbon data, so the same lineage and assurance work that covers your climate reporting extends to the rest of your environmental footprint. Customers use the dashboard data for board reporting, assurance preparation, and as the data layer for broader sustainability disclosure work.

Bring your energy, water and waste data
into one platform with your carbon.