PRODUCT IMPLEMENTED
Corporate Carbon Footprint
INDUSTRY
Palm Oil
Integrated Agribusiness (plantation to CPO mill)
HQ
Jakarta, Indonesia
COMPANY SIZE
5 Subsidiaries & 8 Plantations
~60,000 ha Planted Area
-
Full methodology ownership, with every emission factor, data source, and calculation traceable and auditable by TSE’s team.
-
All relevant scope categories calculated, including complex agricultural emissions (POME, fertiliser, land use change).
-
FLAG accounting delivered, with FLAG and non-FLAG emissions cleanly separated and aligned with SBTi’s Land Sector and Removals Standard.
-
5 business units disaggregated, enabling TSE to compare emissions across its portfolio and identify operational hotspots.
-
Expert SBTi and LSR guidance, with consultative support navigating complex land-sector accounting requirements, including preparation for technical discussions with the SBTi secretariat.
About TSE Group
TSE Group is one of Indonesia’s leading palm oil companies, operating across the full value chain from plantation to processing. Its five business units span operations in Papua and North Maluku. TSE has SBTi-validated near-term and net-zero targets and has publicly committed to a no-deforestation policy, integrating the Forest, Land, and Agriculture (FLAG) sector into its decarbonisation strategy.
"What we appreciated most was the transparency and the expertise. As requirements like SBTi FLAG and LSR evolve, having a static report is no longer enough. With Terrascope, every calculation is visible, and their team helped us navigate complex SBTi requirements that we couldn’t have resolved on our own. This level of transparency is essential for TSE to lead our sustainability agenda with confidence."
Hyehwa Seon
General Manager, ESG Department
![]()
The Challenge
With SBTi-validated targets in place, TSE turned its attention to the next priority: an emissions inventory robust enough to explain and defend to auditors and the SBTi secretariat year after year.
The baseline year inventory had been produced through a conventional consultant-led process that was fit for initial target setting, but not designed for the level of transparency and repeatability TSE now required to track progress against SBTi targets.
Palm Oil Complexity
The complexity of palm oil emissions made this especially difficult. TSE’s inventory required FLAG accounting, covering land use change, palm oil mill effluent (POME), fertiliser application, and farm waste. These are among the most technically demanding areas of GHG measurement. Without visibility into how these categories had been treated previously, there was a need for a more systematized digital foundation for year-on-year comparison and building a credible ongoing reporting programme.
Engagement Goals
TSE needed a partner that could do three things:
-
Digitize and improve upon a legacy, manual-based methodology to ensure long-term consistency,
-
Deliver a fully transparent FY2023 inventory across the full value chain, and
-
Give the TSE team the tools and expertise to own their data going forward.
The Terrascope Solution
Terrascope was engaged to measure TSE’s FY2023 GHG inventory across the full value chain. The engagement combined deep land-sector expertise with Terrascope’s platform capabilities, pairing consultative support from the sustainability team with systematised data collection, calculation, and reporting.
Full-scope measurement. Terrascope measured TSE’s complete Scope 1, 2, and 3 inventory across all five business units. Scope 1 represented the vast majority of the reported inventory, driven primarily by land use change and process emissions. Scope 3 covered 12 categories, with purchased goods and services, processing of sold products, and downstream transportation as the top contributors. Scope 2 (purchased electricity) was minimal.
Comprehensive FLAG disaggregation. Terrascope delivered a full separation of FLAG and non-FLAG emissions, aligned with SBTi’s guidance and the GHG Protocol’Land Sector and Removals (LSR) standard. This gave TSE clear visibility into the specific sources and drivers of their land-related emissions, with FLAG accounting covering land use change, POME, and agricultural inputs separately from energy and industrial categories.
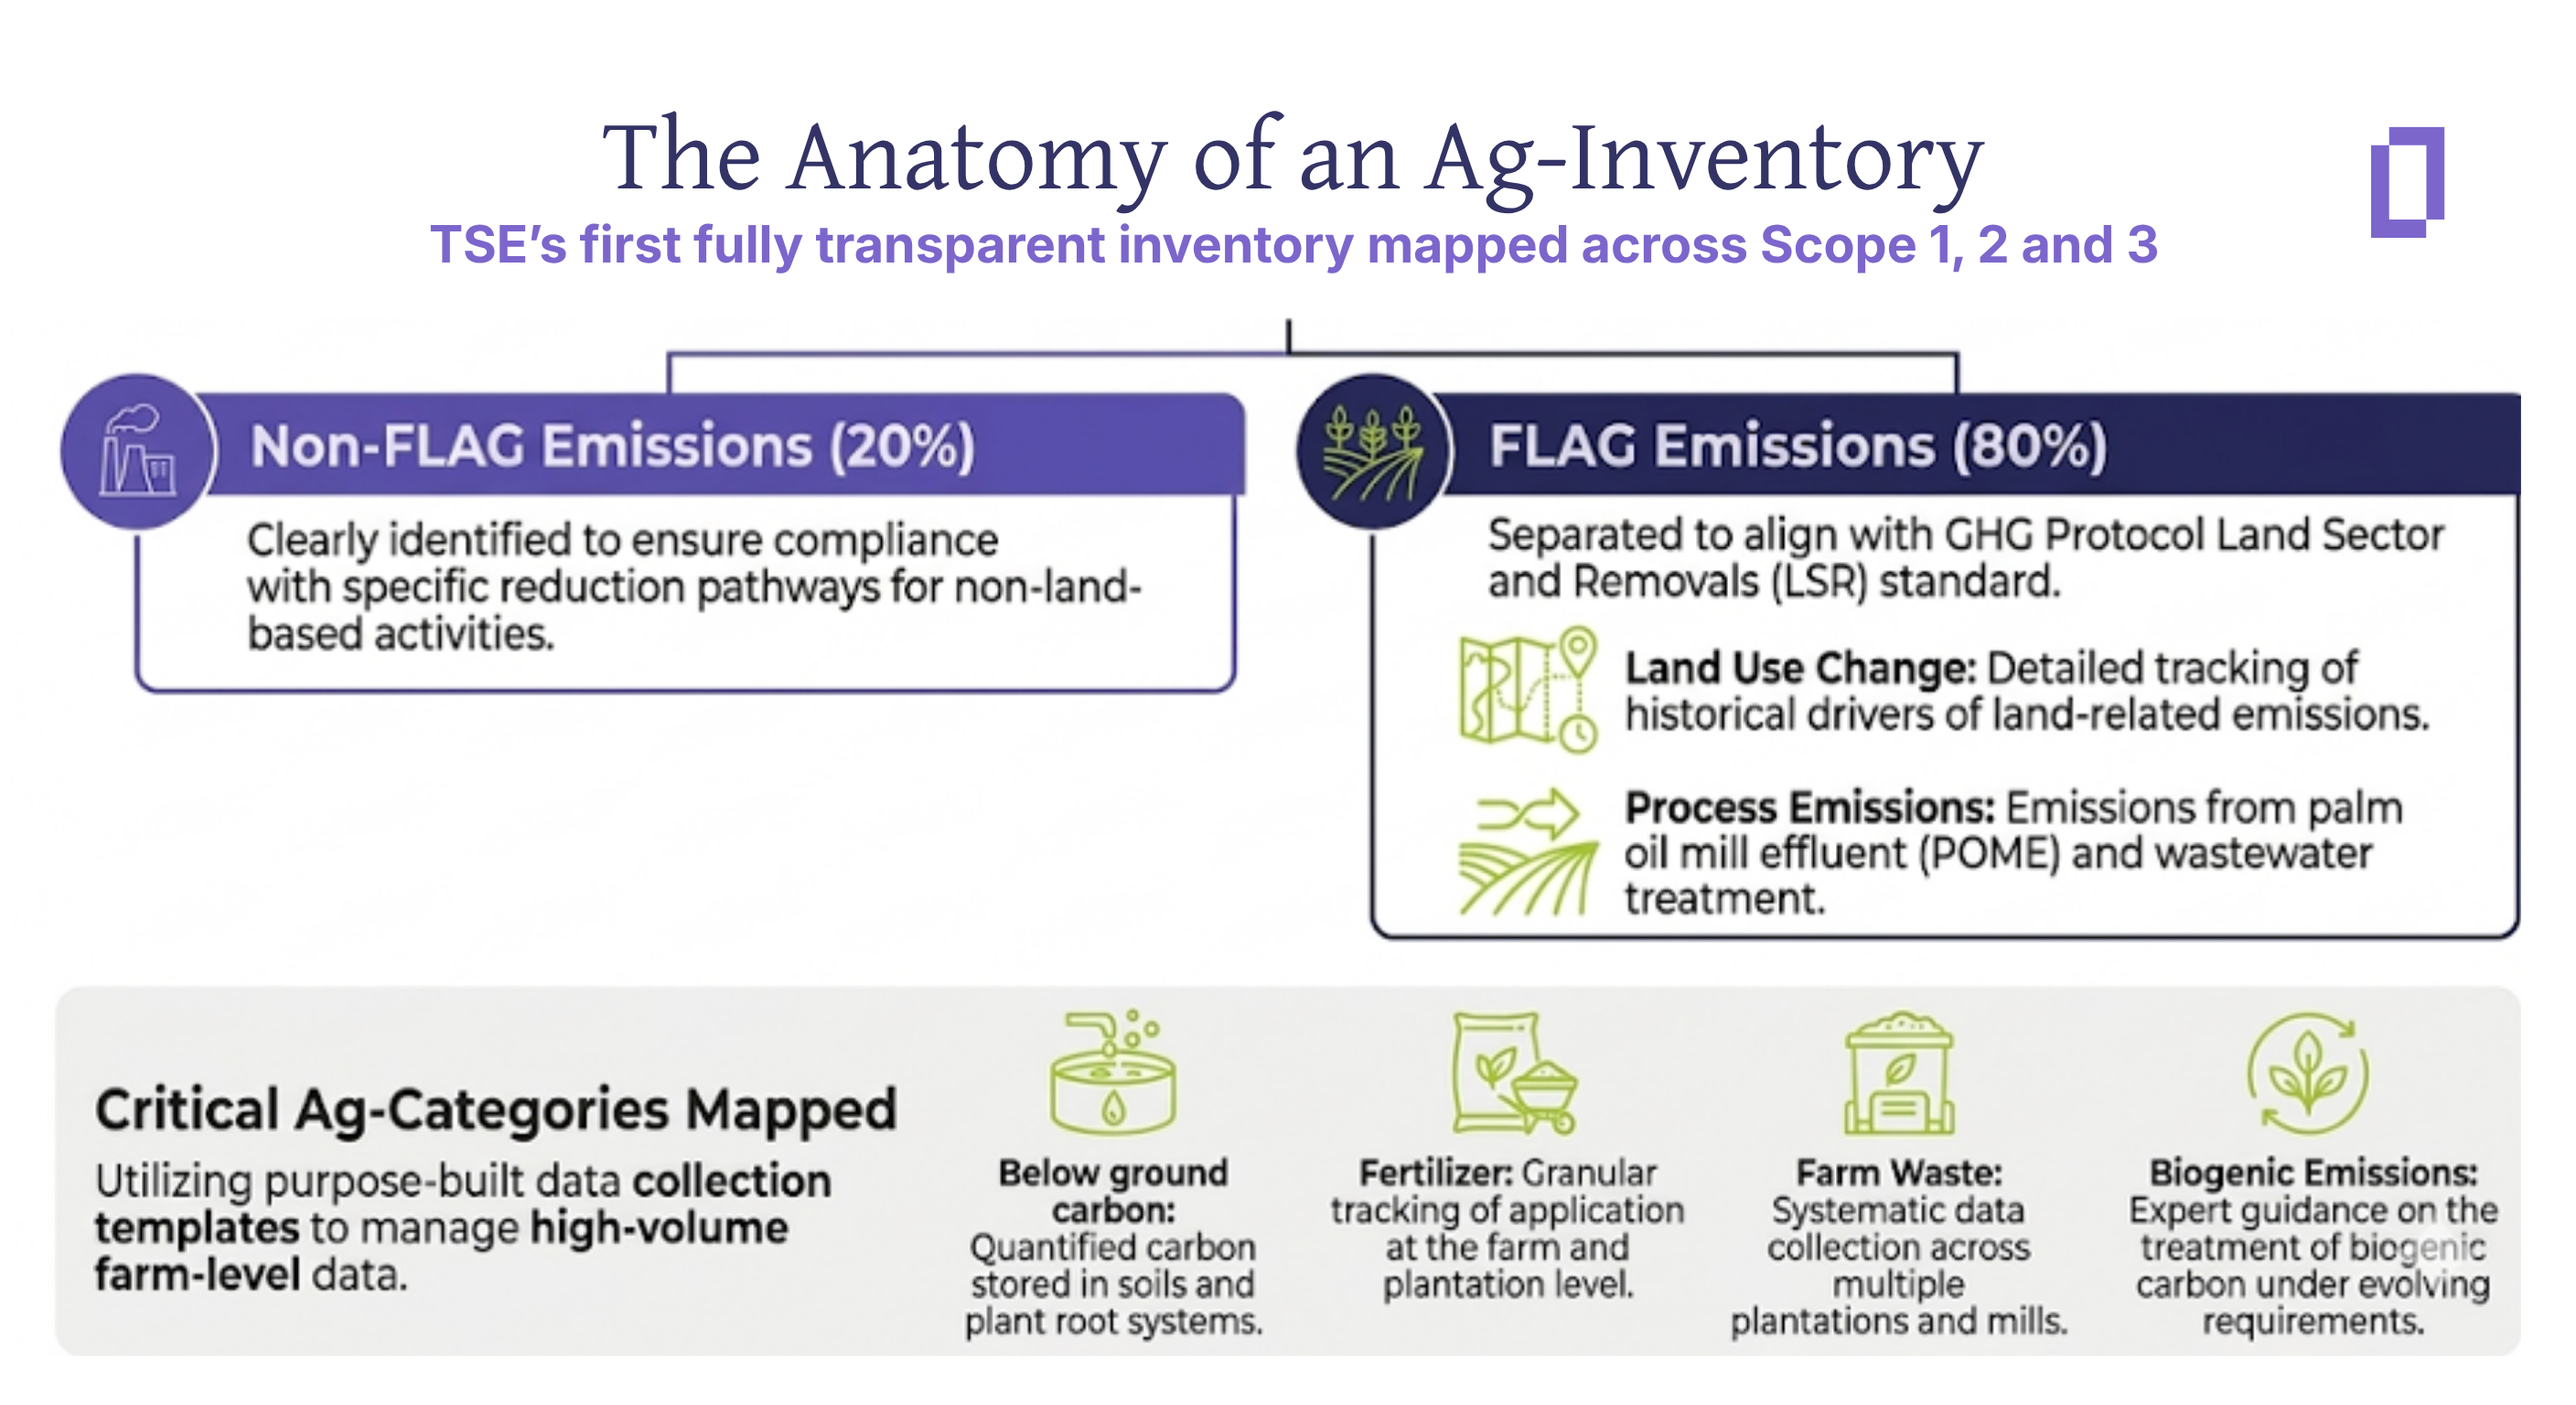
Farm-level data collection at scale. Terrascope deployed purpose-built data collection templates for fertiliser application, wastewater treatment (POME), farm waste, and land use change, handling data in local language (Indonesian) and processing large volumes across multiple plantations and mills. These templates include automated validation, reducing manual error and establishing a repeatable foundation for future measurement cycles.
Expert guidance through SBTi and LSR complexities. Beyond measurement, Terrascope’s sustainability team provided consultative guidance on how TSE should approach its land-sector emissions accounting under evolving SBTi requirements. This included advising on the treatment of biogenic emissions, supporting methodology decisions for complex categories, and helping TSE’s team prepare for technical discussions with the SBTi secretariat, a level of expert support that the team valued as much as the platform itself.
The Impact
The shift from a consultant-produced report to a platform-owned inventory changed what TSE’s sustainability team could do with their data.
From limited visibility to full transparency: Every emission factor, data source, and calculation in the Terrascope platform is traceable. TSE’s team can open any number, see exactly what went into it, and explain it to the board, to investors, or to the SBTi secretariat.
Business unit-level insight: TSE can now compare emissions across its five business units, identify which operations drive the largest footprint, and understand the relative contribution of different activities, from fertiliser inputs to downstream processing to transportation.
A credible foundation for SBTi target tracking: With FLAG and non-FLAG emissions cleanly separated and aligned with the LSR standard, the FY2023 inventory gives TSE an auditable foundation to track progress against its validated science-based targets and demonstrate that progress to stakeholders.
A repeatable system, not a one-off exercise: While the first year required significant consulting effort to reconstruct and improve the inherited methodology, the templates, emission factor mappings, and data workflows are now in place. Subsequent measurement cycles build on this foundation rather than starting from scratch.
Ready to Own Your Carbon Data?
Whether you’re transitioning from a consultant, measuring FLAG emissions for the first time, or exploring science-based targets, our platform and expert team are built for your complexity.