
Summary
-
Agri-commodity and fresh produce groups benefit when every business unit has a unified carbon methodology. Frutura brought six business units, and data from several dozen farms and packhouses, onto one platform.
-
Modelling reductions before investing shows where the big cuts are. Frutura’s business unit teams ran more than 176 decarbonisation simulations.
-
Where a crop is processed can matter as much as how it is grown. MC Agri Alliance found a potential 25% cut in one key commodity supply chain by moving processing to Singapore and changing the shipping route, due to grid and energy mix and emissions intensity.
-
The data now supports investors, regulators and costs. Frutura has one consolidated footprint for investor and regulatory reporting, and MC Agri Alliance’s change would also cut fuel costs.
Your customers and investors want one credible emissions number. Your data sits on farms, in packhouses and mills, in several countries and formats. Most of it comes from land and suppliers you do not control. The GHG Protocol Land Sector and Removals (LSR) Standard takes effect on 1 January 2027 and changes how companies report emissions from land.
These four agri-commodity and fresh produce companies faced the same gap. Each one put its farm and supplier data on one method, found where its emissions came from, and modelled what to change.
The four at a glance
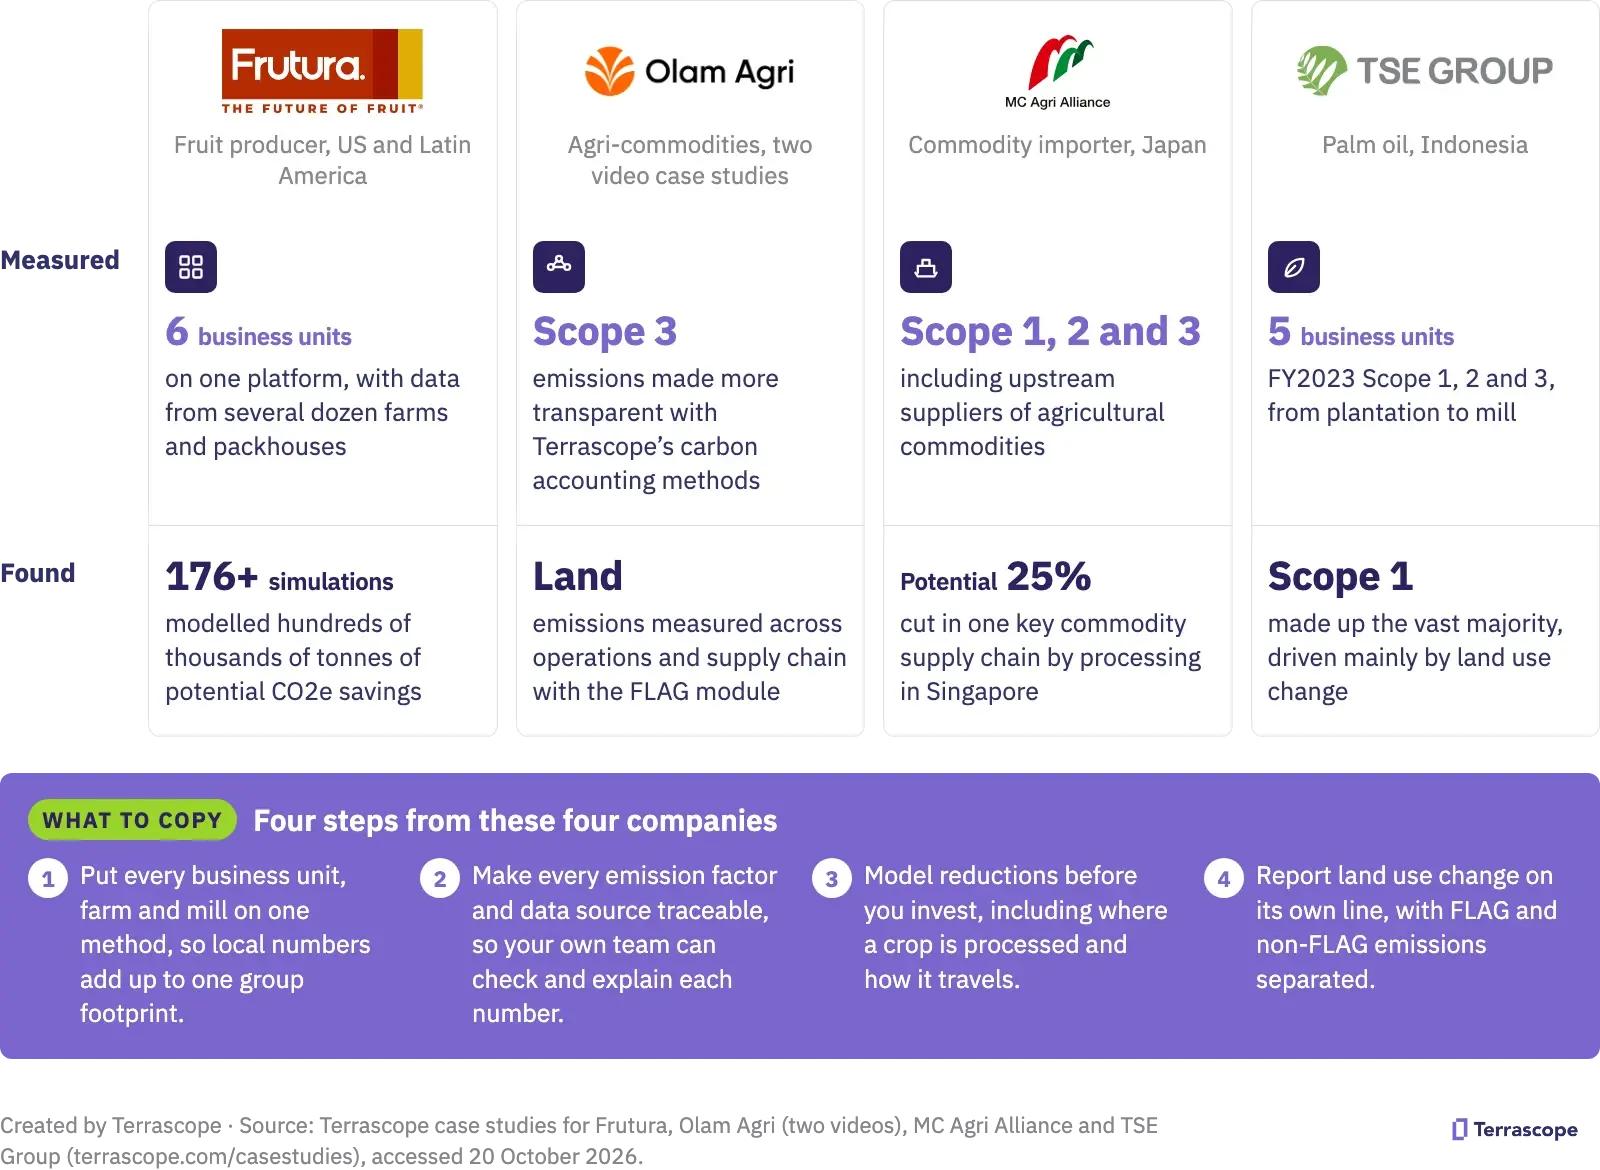
Which example matches your situation?
- Several business units or countries, each measuring its own way → Frutura
- Scope 3 and land emissions you need to explain to finance and investors → Olam Agri
- Imported commodities with long processing and shipping routes → MC Agri Alliance
- Plantations or mills where land use change dominates → TSE Group
How Frutura put six business units on one carbon footprint
Result: one consolidated footprint across six business units, an SBTi-ready FY2024 baseline and more than 176 decarbonisation simulations.
Business outcome: six business units now report into a single source of truth, which gives Frutura a consolidated footprint for investor and regulatory reporting and lets it compare carbon intensity across the group. The platform’s ROI modelling combines carbon impact with financial returns, so decarbonisation capital goes where the impact per dollar is highest. Frutura set an internal, group-wide Scope 1 and 2 emissions intensity reduction goal grounded in what each business unit can deliver.
Frutura is a vertically integrated fruit producer, marketer and distributor with six business units across Latin America and the United States.
- The problem: each business unit runs its own market and collected greenhouse gas data its own way. The group footprint came from a climate consultant as a summary of results, which local operators could not analyse or act on.
- What Terrascope did: onboarded all six business units onto one corporate carbon footprint platform, took in data from several dozen farms and packhouses, and put every business unit on the same methodology. It then trained six business unit sustainability teams to simulate reductions on their own farms and facilities, and its experts combined these bottom-up plans with top-down analysis.
- What it found: recalculating FY2023 on the same basis showed gaps in that year’s activity data, so Frutura chose the more complete FY2024 footprint as its baseline. The teams’ 176+ simulations together modelled hundreds of thousands of tonnes of potential CO2e (carbon dioxide equivalent) savings.
- Quality check: the FY2024 baseline rests on granular, auditable and comparable business unit data, with validation workflows and clear data ownership. The case study describes it as SBTi-ready.
“We work with Terrascope because of the team’s expertise and guidance alongside a technology infrastructure that allows us to maintain decentralized business unit operations while executing group-level climate strategy.”
Jesse Last, VP Sustainability, Frutura
Read the Frutura case study · Watch the Frutura webinar
How Olam Agri brought Scope 3 and land emissions into view
Result: greater transparency on emissions, Scope 3 included, and a way to measure land-based emissions across its operations and supply chain.
Business outcome: Olam is integrating emissions reduction into its ESG and financial strategies, and its sustainability finance team uses Terrascope’s carbon accounting methods for that work.
Olam Agri’s Chief Sustainability Officer and its Global Head of Sustainability Finance describe the work in two video case studies.
- The problem: to build emissions reduction into ESG and financial decisions, Olam needed clear emissions data across its value chain, including Scope 3 and emissions from land.
- What Terrascope did: applied its carbon accounting methods to Olam Agri’s emissions, and provided its FLAG module, which measures land-based emissions from both a company’s operations and its supply chain. FLAG (Forest, Land and Agriculture) is the SBTi’s term for emissions from land use change and farming.
Watch the Olam Agri video with Nikita Asthana · Watch the Olam Agri video with Julie Greene
How an importer and a palm oil grower found their largest sources
MC Agri Alliance
Result: a potential 25% cut in emissions from one key commodity supply chain, found by changing where the crop is processed and how it is shipped.
Business outcome: the same change is cost-effective, because less fuel used in transport translates directly into cost savings. MC Agri Alliance now has a repeatable measurement and reporting process, from 2022 data onwards, so it can track emissions over several years, see what drives year-on-year changes, target value chain hotspots and engage suppliers.
- The problem: MC Agri Alliance, a joint venture between Mitsubishi Corporation and Olam International that imports coffee, cocoa, sesame, nuts, spices, vegetable ingredients and edible oil into Japan, wanted a reliable Scope 3 baseline. Most of its emissions came from upstream suppliers of agricultural commodities, where it had little view of farming and processing.
- What Terrascope did: measured its Scope 1, 2 and 3 emissions, and its experts used the platform to simulate changes to procurement, processing and transport.
- What it found: processing a key commodity in Singapore instead of Japan, and changing its shipping route, could cut emissions from that supply chain by 25%. Singapore’s grid runs mainly on natural gas, while coal still powers about a quarter of Japan’s energy needs, and processing first makes the cargo lighter to ship.
Read the MC Agri Alliance case study
TSE Group
Result: a full FY2023 Scope 1, 2 and 3 inventory across five business units, with every emission factor, data source and calculation traceable.
Business outcome: TSE’s team can open any number and explain it to the board, to investors or to the SBTi. It can compare emissions across its five business units to find operational hotspots, and each new measurement cycle builds on the same templates, emission factor mappings and data workflows instead of starting from scratch.
- The problem: TSE, an Indonesian palm oil company with plantations and mills in Papua and North Maluku, had SBTi-validated targets set from a consultant-led baseline. It could not see how the hardest categories, such as land use change and palm oil mill effluent (POME, the mills’ wastewater), had been treated. Land use change can make up over 90% of palm oil’s emissions for some producers.
- What Terrascope did: measured the inventory, separated FLAG from non-FLAG emissions in line with SBTi guidance and the GHG Protocol LSR Standard, and built data templates in Indonesian that check entries automatically.
- What it found: Scope 1 made up the vast majority of the inventory, driven mainly by land use change and process emissions. Purchased goods and services, processing of sold products and downstream transport were the largest Scope 3 sources.
- Quality check: with FLAG and non-FLAG emissions separated, the inventory gives TSE an auditable foundation to track progress against its validated science-based targets.
“With Terrascope, every calculation is visible, and their team helped us navigate complex SBTi requirements that we couldn’t have resolved on our own.”
Hyehwa Seon, General Manager, ESG Department, TSE Group
Get your commodity footprint in weeks
Terrascope pairs the platform with climate and carbon experts who work with your team from farm data to targets and assurance.
- Agriculture and commodities: emission factors that tell Indonesian palm from Malaysian palm, across 10,000+ origin-commodity combinations
- Corporate Carbon Footprint: Scope 1, 2 and 3 in one inventory across every business unit
- FLAG and LSR: SBTi FLAG targets and reporting under the LSR Standard
- Decarbonise with AI: simulate and compare reduction scenarios, and their cost, before you invest
Further reading
- Palm oil’s “90% emissions” problem
- Does the Land Sector and Removals Standard apply to your company?
- The EU Deforestation Regulation: what you need to know
- How food and beverage companies calculate and cut their emissions: 5 examples
- Best agri-food carbon accounting platforms compared
FAQs
Sources: Terrascope case studies for Frutura, Olam Agri (two videos), MC Agri Alliance and TSE Group (terrascope.com/casestudies, accessed 20 October 2026). Terrascope blog, “Palm Oil’s ‘90% Emissions’ Problem” (Liu Xinlu). GHG Protocol, Land Sector and Removals Standard v1.1.