Every climate target is a comparison. A company promises that its emissions in 2030 will be some percentage lower than its emissions in a chosen base year, and each progress report after that measures the distance between the two. For agricultural companies, the comparison has a particular weakness: the base year itself depends on the weather.
Take a field of wheat. In a wet year, more of the nitrogen fertiliser on it escapes as nitrous oxide, so the field emits more in that year than in a dry one, even though the farmer did nothing differently. Move to a field in a crop rotation, and the crop itself changes from one season to the next. Move to a palm or rubber plantation, and the carbon released when old trees are felled arrives in one year, while the carbon taken up by the new planting accumulates over the following decades.
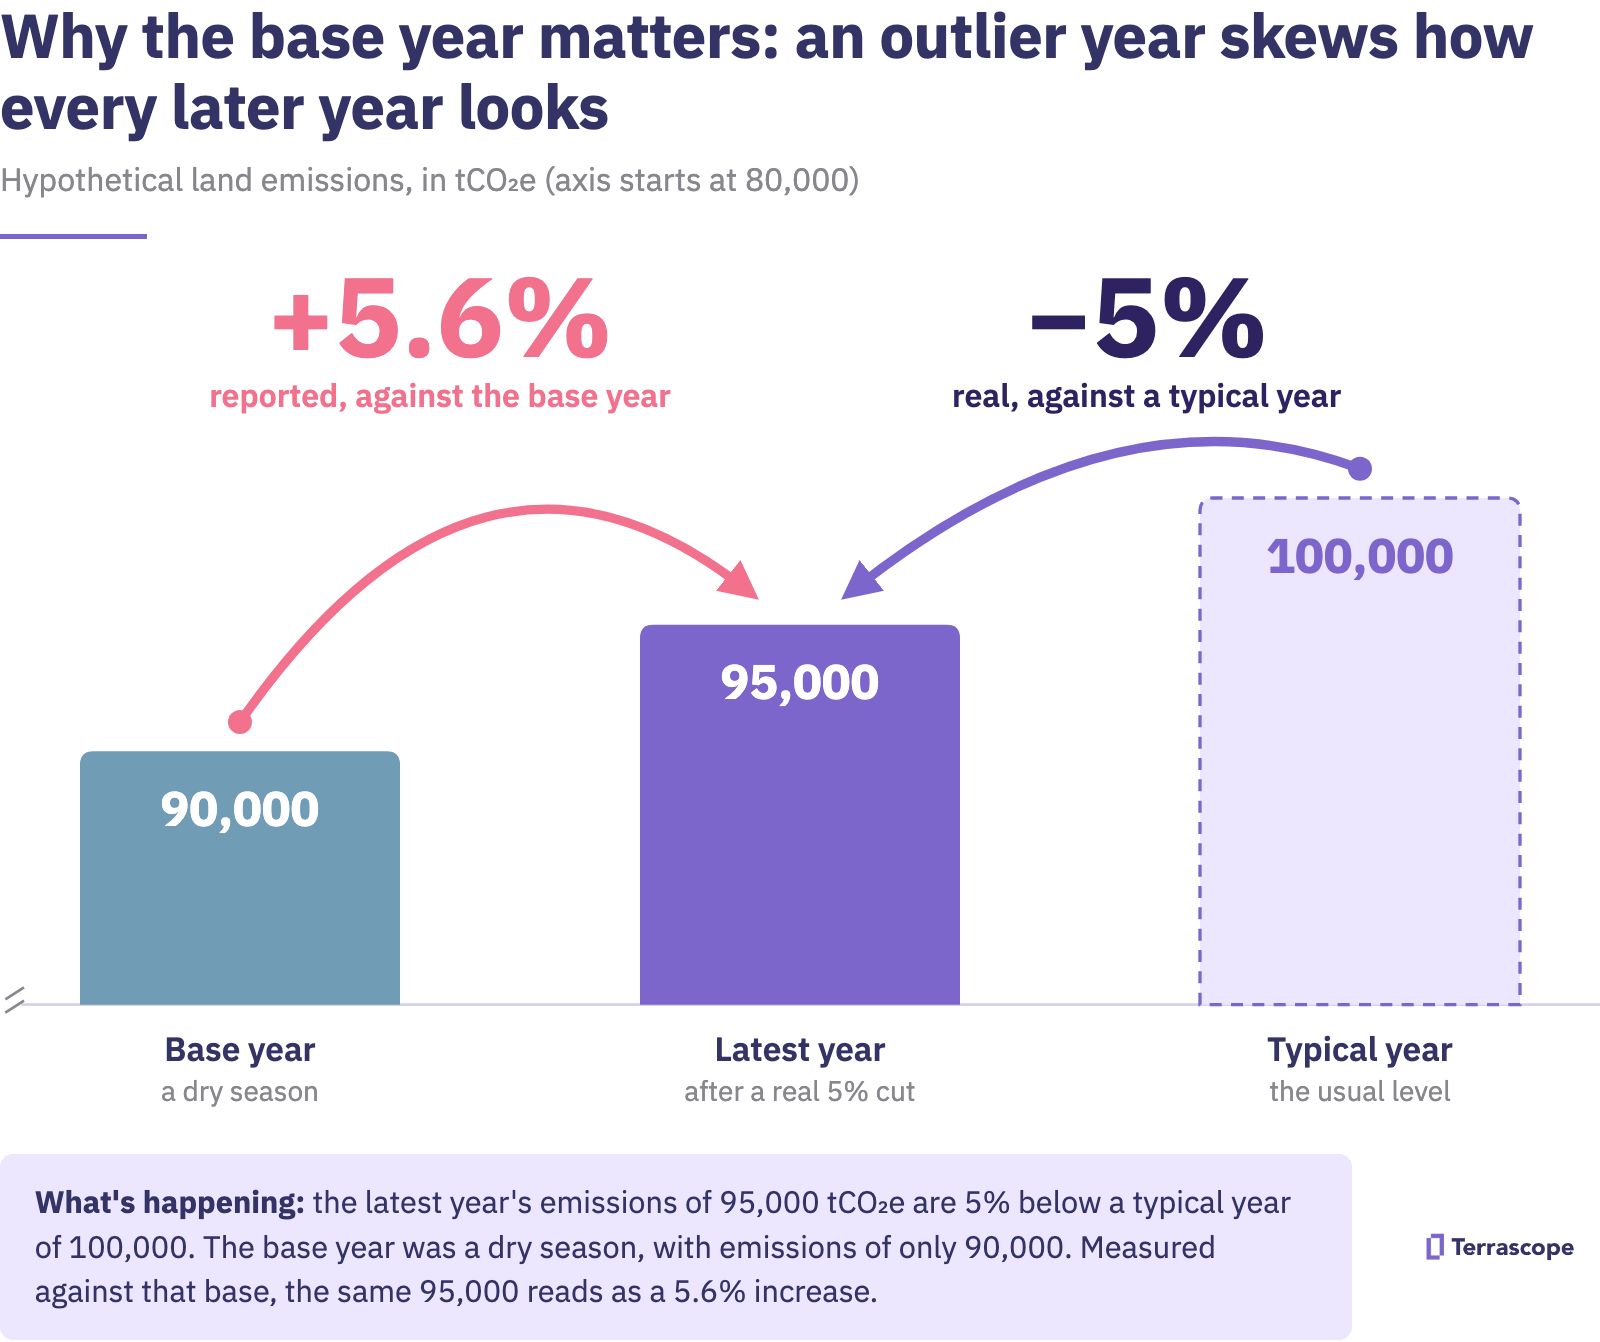
Here is a hypothetical example for a company that picks a low-emissions year as its base. Its land emissions run at about 100,000 tonnes of carbon dioxide equivalent in a typical year, but the base year was a dry one at 90,000 tonnes. Over the next few years the company cuts its typical emissions by 5%, to 95,000 tonnes. Measured against the base year, that real cut shows up as a 5.6% increase. The reverse happens with an unusually high-emissions base year: later years look better than the company's actual performance.
Any company with a land emissions reduction target faces this challenge. Annual progress reports, responses to CDP (formerly the Carbon Disclosure Project) and any commitments to customers or lenders that are linked to the target all measure performance against its base year.
A skewed base year is also hard to correct. The Greenhouse Gas (GHG) Protocol and the Science Based Targets initiative (SBTi) require a company to recalculate its base year when its structure changes, when its calculation methods change, or when it finds a significant error. An unusual season is none of these, so the skewed year stays in place as the reference point.
Keep reading to see how to choose the base for agricultural emissions, how to smooth the swings, when to recalculate, and how to explain emissions changes year to year.
Quick Reference Guide
-
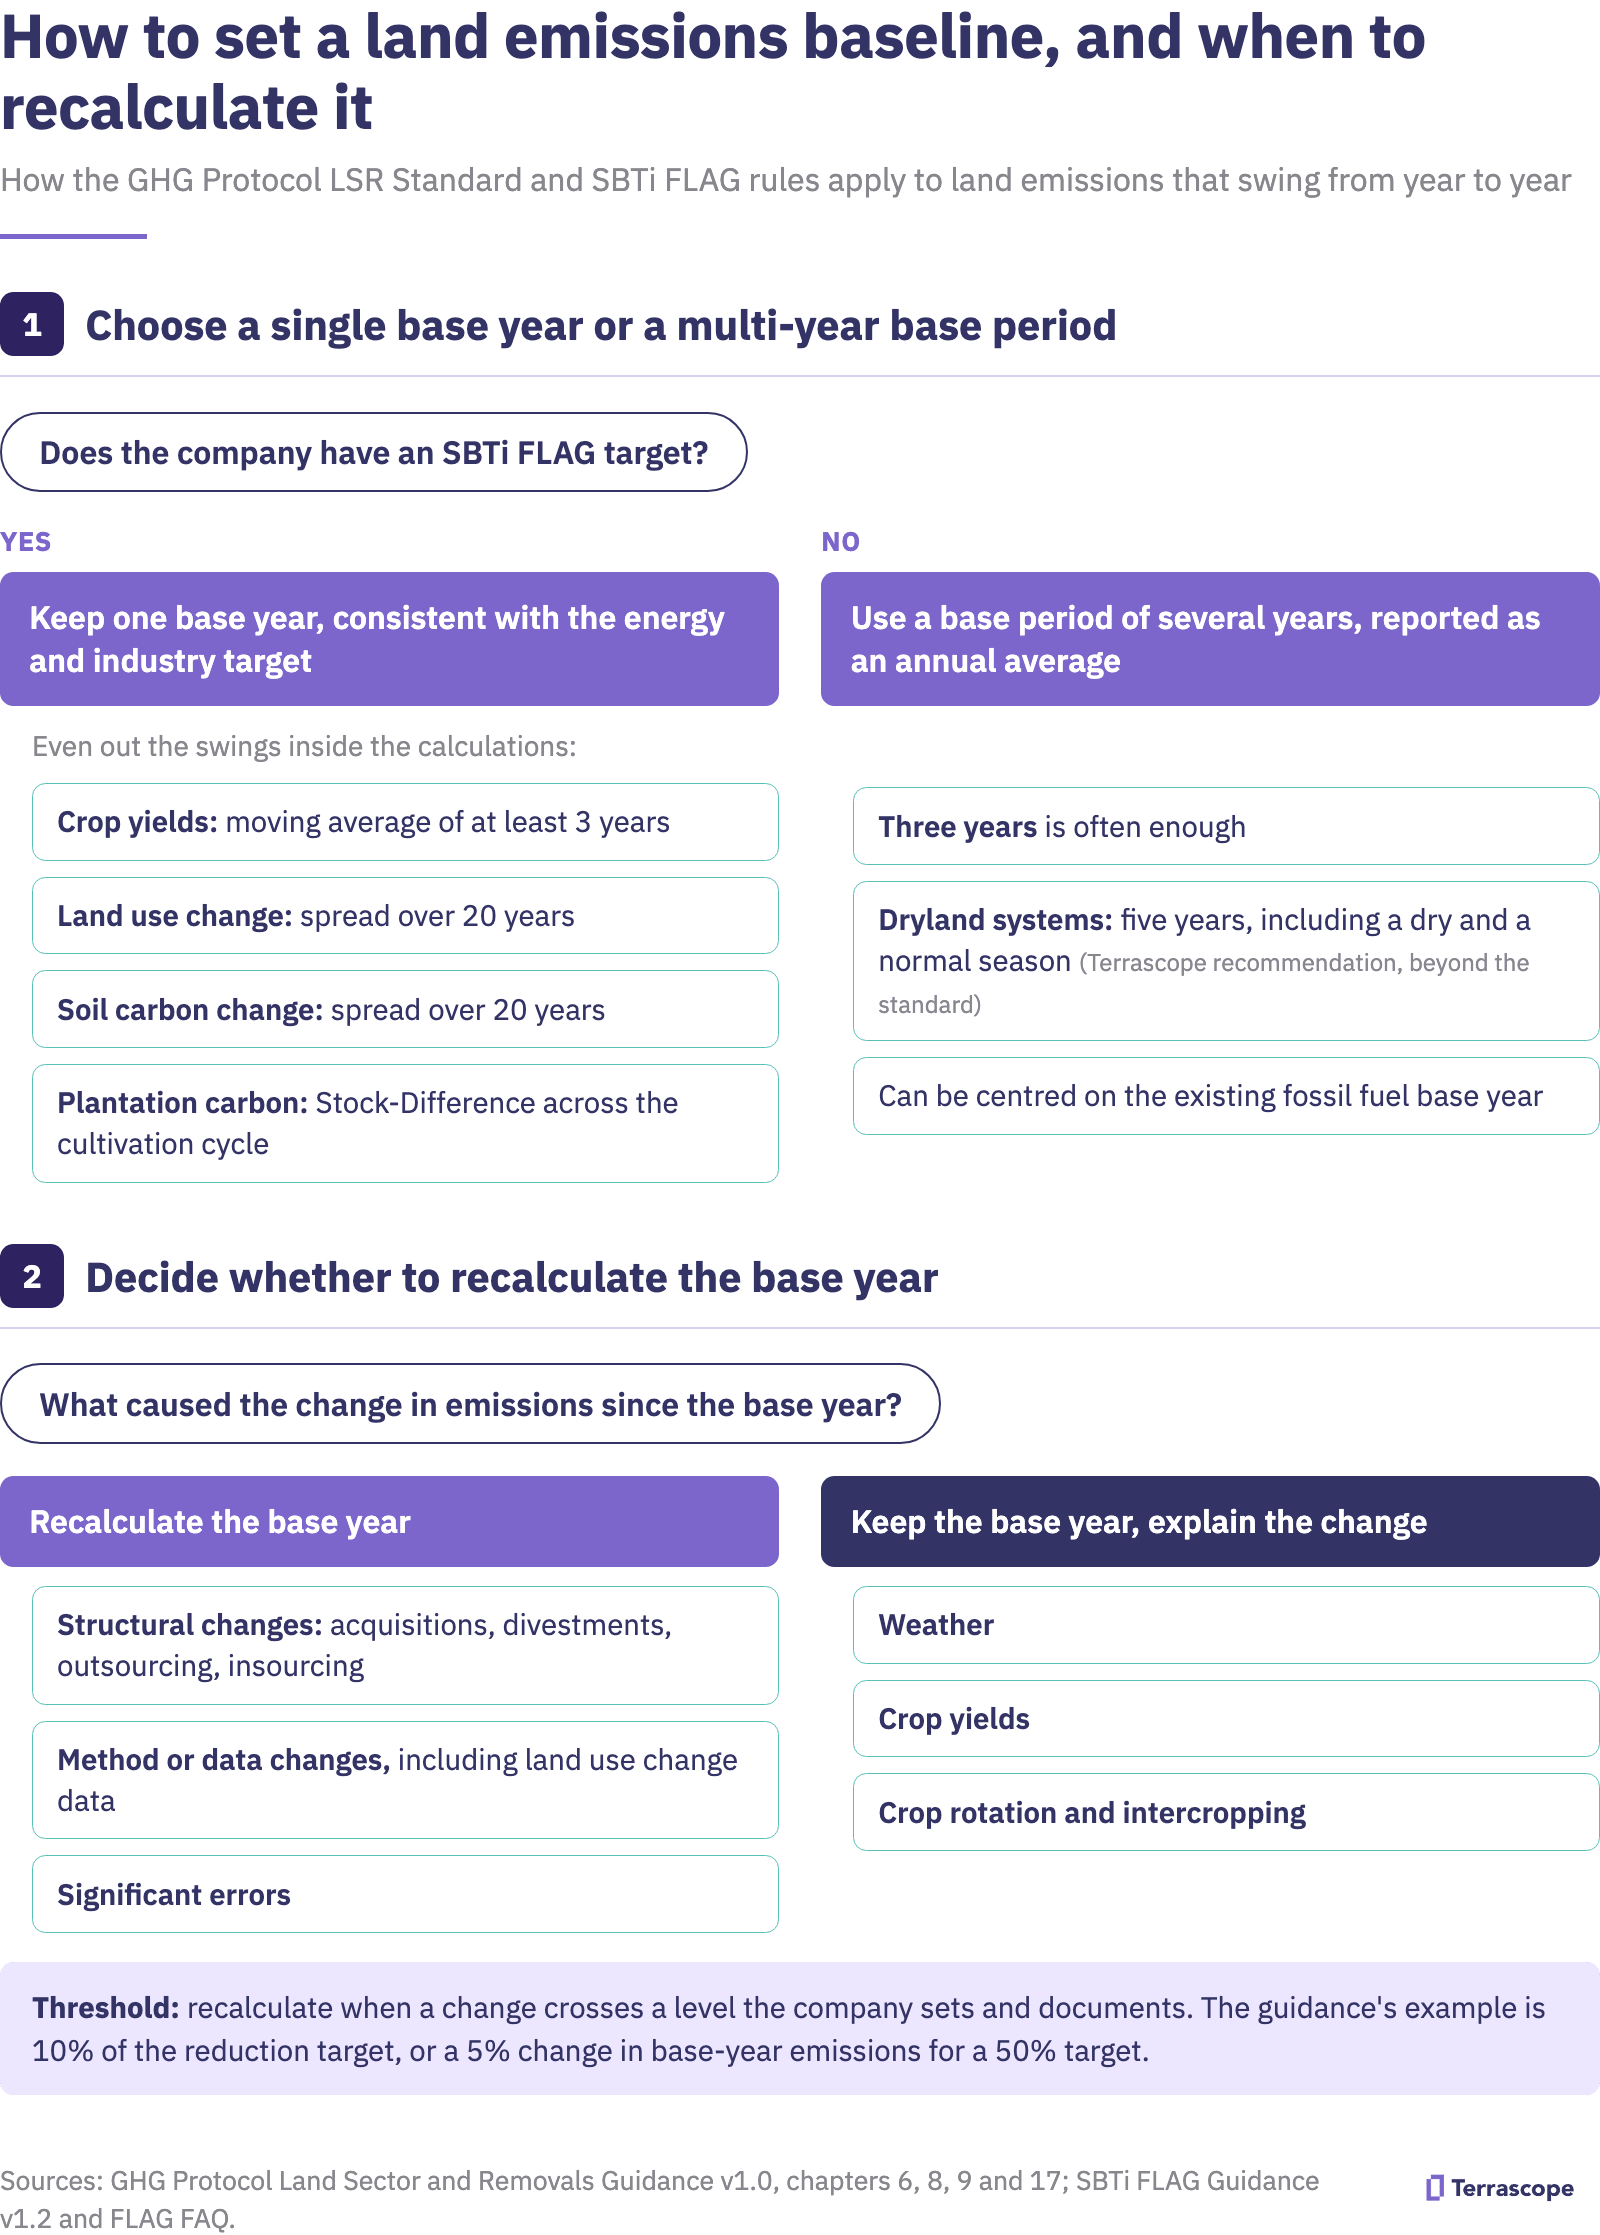
With an SBTi target, keep one base year and even out the year-to-year swings in the methods used to calculate that year's land emissions. Under the GHG Protocol, the target-setting requirements of programmes such as SBTi take precedence over its own. SBTi states that the base years of a company's Forest, Land and Agriculture (FLAG) target and its energy and industry target "must be consistent". The averaging then comes from the land accounting methods: a moving average of crop yields, land use change spread over 20 years, soil carbon change spread over 20 years, and plantation carbon measured over the whole cultivation cycle.
-
Without a programme rule, use a base period of several years. The GHG Protocol recommends a base period for land emissions and removals, reported as an annual average. Three years is often enough, and longer periods may be justified for dryland systems.
-
Recalculate only for structural changes, method or data changes, and significant errors. Weather, yields, crop rotation and intercropping are reasons to explain a result, and they leave the base year unchanged.
-
Explain each year's change by its causes. A breakdown of the change since the base year lets readers tell real progress apart from a good or bad season.
What the standards say
GHG Protocol Land Sector and Removals (LSR) Standard
The GHG Protocol Land Sector and Removals (LSR) Standard takes effect on 1 January 2027, so it applies from the 2027 reporting year and to reports published in 2028. Here are key points from its guidance on targets and tracking land emissions over time.
Programme rules come first. For companies in target-setting programmes such as SBTi, the chapter says "the target-setting requirements set by those programs take precedence over the target-setting requirements in this chapter."
For land, the guidance recommends a base period of several years. Land carbon varies so much from year to year that a single year can mislead. Three years is often enough to even this out, and longer periods may be justified for dryland ecosystems. The period is reported as an annual average, so a 2020–22 base period is the average of 2020, 2021 and 2022. It can be centred on the base year the company already uses for its fossil fuel emissions.
Targets spread over several years absorb the weather. The guidance recommends land targets that cover several consecutive years, expressed as an annual, average or cumulative figure. It also recommends separate targets for land emissions and fossil fuel emissions, and it requires separate targets for emissions and for removals (carbon taken out of the atmosphere and stored in soil or trees).
Intensity targets for agricultural products should use kilocalories or protein as the denominator, because these reflect the energy or nutritional value of the food better than weight does.
SBTi FLAG Guidance v1.2 and FLAG FAQ
Companies setting FLAG targets must use the same base year for FLAG targets and E&I targets over each scope, as prescribed in theSBTi Services Criteria Assessment Indicators v1.7 (14 April 2026). For a company with an SBTi target, the year-to-year swings are therefore evened out inside the methods used to calculate land emissions.
From 1 January 2027, SBTi expects FLAG base-year emissions to be calculated in line with the LSR Standard. SBTi is revising the guidance as the FLAG Standard V2.0. Its Terms of Reference expect the new Standard by or before the first quarter of 2028.
The averaging already built into land emissions accounting
Several accounting rules help agricultural companies to even out year-to-year changes irrespective of a base year:
-
Land use change: emissions from converting land are spread evenly over the 20 years after the conversion.
-
Soil carbon: the Intergovernmental Panel on Climate Change (IPCC) default method spreads a change in the soil's carbon stock evenly over 20 years.
-
Plantation carbon stocks: carbon stored on the land can be measured at two points in the cultivation cycle and the difference annualised (the Stock-Difference method).
-
Crop yields: when a company calculates how much land it occupies from crop yields, the LSR guidance recommends a moving average of at least three years, to "account for annual yield fluctuations due to non-anthropogenic factors". The most recent three years, including the reporting year, are ideal. Official statistics often lag, so the latest three years available will do, as long as the company discloses which years it used (LSR Guidance sections 8.4.2 and 8.5.3).
One consequence to know: a company that moves from standard emission factors to process models or measured data will usually see its reported emissions become more variable, because models respond to the weather. That change of method is itself a reason to recalculate. The efficient approach is to plan the switch and recalculate the baseline once.
How it works with four agricultural examples
The standards set their rules by how carbon behaves on the land rather than crop by crop. Four systems are common in food and agriculture supply chains.
| System | Examples | What makes emissions swing | How to even them out |
| 1. Tree crops and intercropped plantations | Palm oil, coconut, cocoa, coffee, tea, rubber | Felling releases carbon in one year; the new planting takes it back up over decades | Stock-Difference over the cultivation cycle; a base with a typical amount of replanting |
| 2. Annual crops in rotation | Sugar beet, potatoes, cereals, soy, maize | The crop, fertiliser use, residues and soil carbon change each season | A base covering a full rotation; emissions allocated across the rotation |
| 3. Pasture and livestock feed | Dairy, beef, poultry | Herd size, feed and manure management; drought through pasture and feed | Each cause reported separately; purchased feed treated like rotated crops |
| 4. Dryland and weather-exposed systems | Rain-fed crops in dry regions | Very different emissions in a drought year and a normal year | A longer base period, or a longer yield average under an SBTi target |
1. Tree crops and intercropped plantations
Trees store carbon in their trunks, branches and roots, so the replanting cycle drives a plantation's land emissions. Felling an old stand releases a large amount of carbon in one year, and the new planting takes it back up over the decades that follow.
-
Replanting counts as land management. Replanting palm on old palm, or rubber on old rubber, leaves the land in the same category: cropland stays cropland. Land use change applies only when land moves between categories, such as from forest to cropland. A plantation established on forest within the past 20 years still carries the land use change emissions from that conversion in each year of the 20-year window, counted separately from the replanting.
-
Carbon changes can be averaged over the cycle. The LSR Standard allows a company to measure the carbon stored on the land at two points in the cultivation cycle and divide the difference by the number of years between them (the Stock-Difference method). The result shows the net effect of the whole cycle and spreads out the spike in the felling year.
-
An intercropped plot is one system. Coconut grown with cocoa, or rubber with coffee, shares one area of land and one set of inputs. The LSR guidance advises against splitting the emissions by a physical measure such as weight. It recommends instead, in order: (1) economic allocation, by each product's share of the plot's total value; (2) allocation by area and time, in square metre-years. Either can be calculated for the reporting year or over the full rotation.
-
Shade trees can be treated like cover crops. The guidance adds that the cover-crop approach may also apply to agroforestry systems with trees that are not tied to the harvested product (sections 6.3 and 6.4.5). Shade trees that produce nothing for sale can therefore have their emissions and removals assigned to the crops that are sold.
-
The base should reflect a typical amount of replanting. A base year, or a three-year base period, that happens to include an unusually large replanting block will overstate normal emissions. Disclosing the share of the area replanted in the base makes this visible.
2. Annual crops in rotation
On a rotated field, the crop changes from year to year, and so do fertiliser use, crop residues and soil carbon.
-
The base should reflect the whole rotation. A base period should cover at least one full rotation. Carbon credit methods follow the same logic: Verra's VM0042 method builds each field's baseline from at least three years of history, including at least one complete rotation. A company with a single SBTi base year can disclose where that year falls in the rotation and rely on rotation-level allocation to even out the crop-by-crop swings.
-
Emissions are shared across the full rotation. The LSR guidance recommends that companies "calculate carbon stock changes and other GHG emissions over the full crop rotation and then allocate those emissions across all crops in the rotation" (section 6.4.5). The crops in a rotation share their inputs. Nitrous oxide from fertiliser applied to one crop can escape while the next crop is growing. In a corn-corn-soy rotation, the soy fixes nitrogen from the air, the following corn uses it, and so the corn needs less fertiliser. Sharing emissions across the rotation shares that benefit between the crops.
-
Cover crops and fallow years are charged to the crops that are sold. The guidance spreads their emissions across all the cash crops in the rotation, or assigns them to the next cash crop when there is only one.
-
Soil is sampled at the same point in every rotation. Soil carbon measured straight after a root crop such as sugar beet looks worse than soil measured at the end of a full rotation. A fixed sampling point keeps the years comparable.
3. Pasture and livestock feed
Emissions from animals and manure mostly follow herd size, feed and manure management, which are easier to track than soil emissions. Weather still matters through pasture growth and feed, especially in a drought. Carbon in pasture soils follows the same rules as carbon in cropland soils.
-
Purchased feed behaves like the crops in rotation. Soy and maize bought as feed bring rotation effects and land use change into a livestock footprint, only where primary data is used and not industry averages.
-
Each cause is reported separately. Herd management, feed additives and the mix of sources each change the total, and seeing the drivers is useful for stakeholders.
4. Dryland and weather-exposed systems
Rain-fed crops in dry regions can produce very different emissions in a drought year and a normal year. The LSR guidance says a base period longer than three years may be justified for dryland ecosystems.
-
Where a company is free to set a base period: Terrascope's recommendation, which goes beyond the standard, is to start from five years and check that the period includes both a dry season and a normal one.
-
Where a company is bound to a single SBTi base year: it can extend the averaging inside its calculations instead, for example by using a yield average of more than three years, which the guidance's "at least three years" allows.
Explaining the changes in a report
Growers and producers have so far kept to a single base year, which is what SBTi's matching base-year rule leads to. The palm oil groups with FLAG targets are an example:
| Company | FLAG target base year |
| IOI | FY2020 for its SBTi-validated scope 1 FLAG target; FY2022 for its scope 3 FLAG target |
| SD Guthrie | FY2020 |
| Wilmar | 2022, for its SBTi-validated target |
| Golden Agri-Resources | 2022, for a target to cut absolute scope 1 and 3 FLAG emissions by 30% by 2030, following SBTi guidance |
None of the producer reports reviewed for this analysis uses an average of several years as its base. Producers handle the year-to-year changes in other ways.
1. Report intensity alongside the absolute total
Fonterra's FLAG target is an intensity target: a 30% cut in scope 1 and 3 FLAG emissions from dairy per tonne of fat-and-protein-corrected milk by FY2030, from an FY2018 base year. An intensity measure removes the effect of a bigger or smaller milk pool, and fat-and-protein-corrected milk sits close to the protein basis the LSR guidance recommends for agricultural intensity targets.
Arla's SBTi-validated target is absolute, a 30.3% cut in FLAG emissions from raw milk and externally sourced whey between 2020 and 2030, and it reports emissions per kilogram of owners' milk next to it. In 2025 the per-kilogram figure stood 9.9% below 2020. Higher milk deliveries from its farmer owners pushed emissions under the FLAG target up by 4.4 percentage points in the same year, leaving them 3.7% below the 2020 baseline. Arla's explanation: "This volume growth outweighed the per-kg reductions".
The absolute and intensity figures together show readers how much of the change came from volume and how much from performance on farms.
2. Name the cause of each year's change
Select Harvests, an Australian almond grower, reported a 3.5% fall in emissions in FY2025 and gave two reasons: "lower yield-related activity and staged upgrades to high-efficiency motors in processing lines." One cause is the harvest and the other is reduction work, and the report says so.
Adecoagro, which farms crops, rice, dairy and sugarcane in South America, measures its net scope 1 and 2 emissions relative to total production volume against a 2021 base year, and tells readers: "We expect an oscillating carbon intensity with a decreasing trend". It also leaves soil carbon sequestration out of its target, noting "huge variability on potential carbon sequestration estimations" and "ongoing technical discussions regarding its calculations".
3. Separate better data from real reductions
SD Guthrie reported a 37% net fall in scope 1 FLAG emissions against FY2020, and attributed it to its No Deforestation, No Peat, No Exploitation (NDPE) policy and to "enhanced data availability and quality". Naming data quality as a cause tells readers that part of the change came from measuring better. A driver breakdown would show how large that part is.
4. Restate the base year when methods or structure change
Treasury Wine Estates restated its FY21 base year in FY25 after correcting "errors identified due to system limitations and methodological inaccuracies" in sources including fertiliser, pruning residues and land use change. Fonterra's sale of its consumer businesses to Lactalis in March 2026 triggered SBTi re-validation requirements, and Fonterra says its existing targets remain in place in the meantime.
In each case the trigger was a method change, an error or a change in structure. None of the producers reviewed changed its base year because of weather or yield.
A breakdown by cause
A breakdown of land emissions by cause can be organised into these six drivers:
| Cause | Example |
| Reduction action | Cover crops, more efficient fertiliser use, feed additives |
| Activity and volume | More or less product bought |
| Sourcing mix | A shift between origins or suppliers |
| Weather and yield | A drought, a wet season, a low harvest |
| Method and data | New emission factors, farm-level data replacing averages |
| Scope and structure | Acquisitions, divestments, newly covered categories |
How Terrascope helps
Agricultural companies need a base year that holds up for the life of the target: through SBTi validation, assurance, annual progress reports, and questions from customers and lenders. Terrascope helps build one. It calculates land emissions in line with the GHG Protocol Land Sector and Removals Standard, keeps land use change, land management and fossil fuel emissions separate, and uses crop-, location- or farm-specific data in place of industry averages wherever a company has it. When a method or data source changes, the base year can be recalculated and traced back to its sources, so each year's result can be explained by its causes.
Terrascope's specialists work with sustainability teams to choose the base, set the allocation approach for rotations and intercropping, and write the recalculation policy behind an SBTi FLAG target.
Next step
Frequently asked questions
Sources
GHG Protocol, Land Sector and Removals Standard v1.1 (effective date 1 January 2027): ghgprotocol.org
GHG Protocol, Land Sector and Removals Guidance v1.0, Chapter 17 (Setting targets and tracking progress, including section 17.4.1): ghgprotocol.org
GHG Protocol, Land Sector and Removals Guidance v1.0, Chapter 9 (land management and carbon stock monitoring): ghgprotocol.org
GHG Protocol, Land Sector and Removals Guidance v1.0, Chapter 6 (allocation, sections 6.3 and 6.4.5): ghgprotocol.org
GHG Protocol, Land Sector and Removals Guidance v1.0, Chapter 8 (land occupation, sections 8.4.2 and 8.5.3): full guidance PDF, ghgprotocol.org
SBTi, FLAG Guidance v1.2: sciencebasedtargets.org
SBTi, FLAG FAQ: sciencebasedtargets.org
SBTi, FLAG Standard V2.0 Terms of Reference: sciencebasedtargets.org
IPCC 2019 Refinement, Volume 4, Chapter 5 (Cropland): ipcc-nggip.iges.or.jp
Verra, VM0042 Improved Agricultural Land Management: verra.org
Arla, Annual Report 2025 (pages 20 and 25, key figures): arla.com
Arla, "Arla updates science-based targets to align with SBTi FLAG guidance" (10 November 2025): arla.com
Arla, report under the EU Code of Conduct on Responsible Food Business (2026): transition-pathways.europa.eu
Fonterra, Our climate ambitions: fonterra.com
IOI, "IOI's science-based targets validated by SBTi": ioigroup.com
SD Guthrie, Sustainability Report 2025: insage.com.my
Wilmar, news release on SBTi validation of net-zero targets (27 March 2025): links.sgx.com
Golden Agri-Resources, Sustainability Report 2024 (SGX filing, page 34): links.sgx.com
Select Harvests, Sustainability Report 2025: selectharvests.com.au
Adecoagro, GHG Management Program 2025: sustainability.adecoagro.com
Treasury Wine Estates, 2025 Sustainability Report Basis of Preparation: storyblok.com