Summary
Energy is the sector responsible for the largest share of greenhouse gas emissions. Burning fossil fuels for electricity, heat, industry, transport and buildings causes about three-quarters of global emissions. Looking at direct emissions, the IPCC puts energy supply at 34%, industry at 24%, agriculture, forestry and land use at 22%, transport at 15% and buildings at 6%.
Which sector is responsible for the most greenhouse gas emissions?
The energy sector is responsible for the most emissions. Most of the world's electricity, heat and transport still runs on coal, oil and gas.
How large the share looks depends on how you group the sectors. Under the IPCC's split, "energy supply" (power stations, refineries, fuel extraction) is the largest single sector, at 34% of global net emissions in 2019. If you also count the fuel burned in factories, vehicles and buildings, energy use makes up about three-quarters of the total. Global emissions in 2024 were a record 57.7 GtCO2e, according to UNEP's Emissions Gap Report 2025.
What is the breakdown of global emissions by sector?
The table below uses the IPCC's latest sector breakdown, which covers all greenhouse gases and land use.
| Sector | Share of global net GHG emissions, 2019 (direct) | Share with electricity and heat assigned to the user | Main sources |
| Energy supply (power, heat, fuel production) | 34% | n/a (reallocated to users) | Coal and gas power stations, oil and gas extraction, methane leaks |
| Industry | 24% | 34% | Steel, cement, chemicals, aluminium; industrial process emissions |
| Agriculture, forestry and other land use (AFOLU) | 22% | 22% | Livestock methane, fertiliser N2O, rice, deforestation |
| Transport | 15% | 15% | Road vehicles, aviation, shipping |
| Buildings | 6% | 16% | Heating, cooking, cooling, electricity used in homes and offices |
Source: IPCC AR6 Working Group III, Summary for Policymakers (2022). Total for 2019: 59 GtCO2e. Shares are rounded, so columns may not add to exactly 100%.
Our World in Data publishes a similar breakdown based on Climate Watch data. It groups all fuel burning under "energy", which is where the "about three-quarters" figure comes from.
Why does energy produce the most emissions?
Energy produces the most emissions because fossil fuels still supply most of the world's power and heat, and burning them releases CO2.
- Coal emits the most CO2 per unit of energy and still produces much of the world's electricity, especially in Asia.
- Oil powers most transport and many industrial processes. Emissions come from extraction, refining and combustion.
- Natural gas emits less CO2 than coal when burned, but methane leaks from wells and pipelines add to its footprint.
For a company, fuel burned on site is Scope 1 and purchased electricity is Scope 2. See all about GHG scope categories.
How much does industry contribute?
Industry is the second-largest direct source, at 24% of global emissions in 2019, and 34% once its electricity use is counted (IPCC AR6 WGIII).
- Cement: most cement emissions come from turning limestone into clinker, which releases CO2 chemically as well as from the fuel used (IEA, cement).
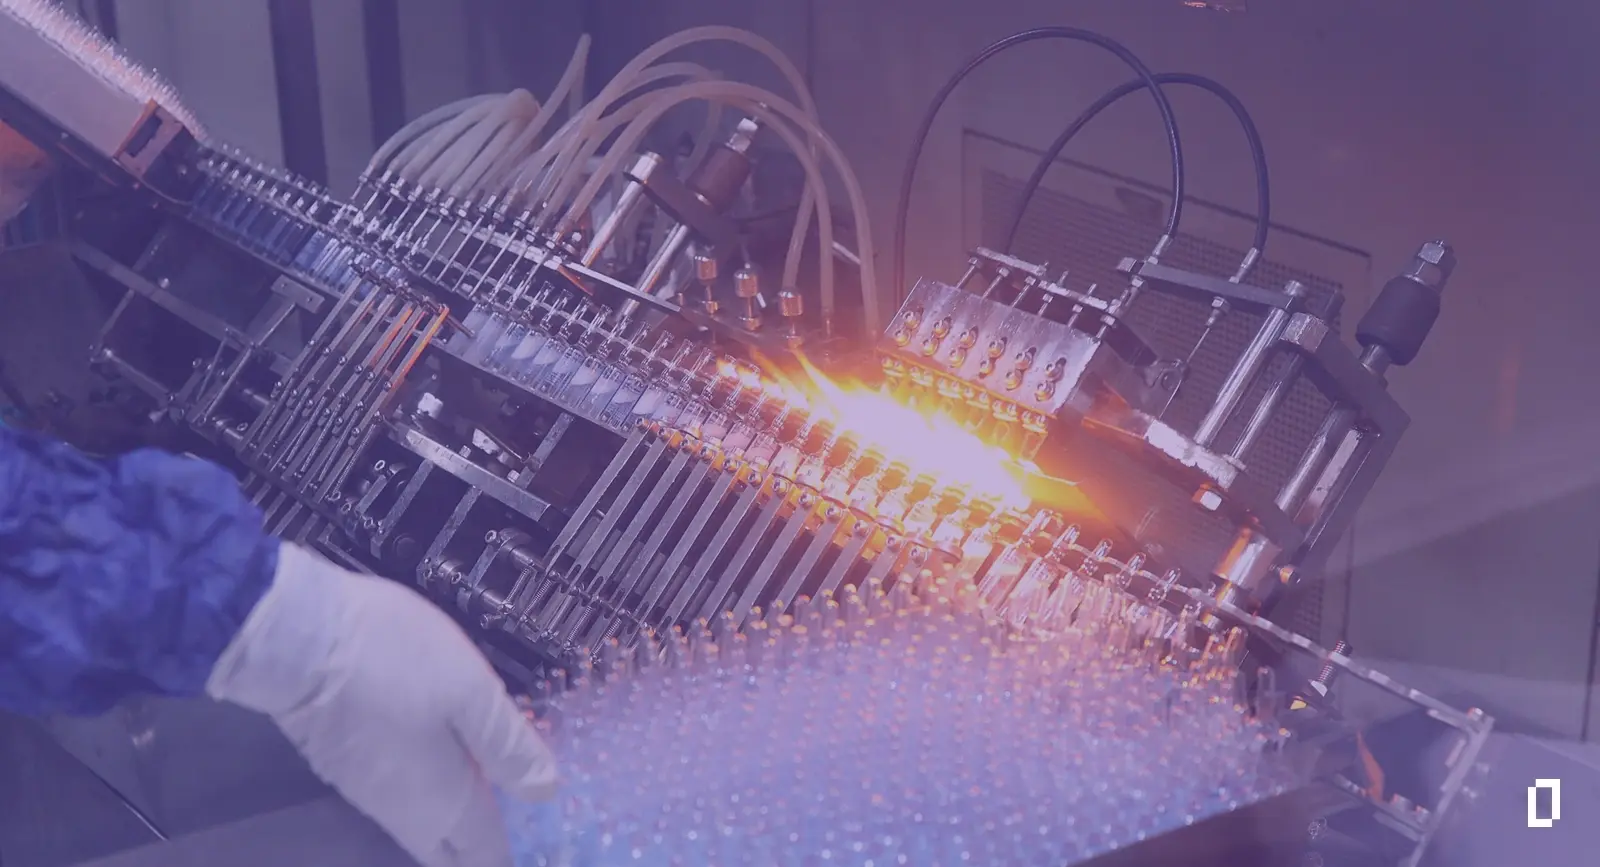
- Steel and aluminium: blast furnaces use coal as both fuel and a chemical input. Aluminium smelting uses large amounts of electricity.
- Chemicals: emissions come from fossil feedstocks, high-heat processes and by-products such as N2O from nitric and adipic acid.
- Waste: landfills release methane as organic waste rots. UNEP estimates waste causes about 20% of human methane emissions (Global Methane Assessment, 2021).
How much do agriculture and land use contribute?
Agriculture, forestry and other land use produced 22% of global emissions in 2019 (IPCC AR6 WGIII). This sector is where most of the methane and nitrous oxide comes from.
- Livestock: cattle and other ruminants produce methane during digestion. Manure releases methane and N2O.
- Crops: nitrogen fertiliser releases N2O, and flooded rice fields release methane.
- Deforestation and land-use change: clearing forest for farmland releases the carbon stored in trees and soil. UNEP found that deforestation and forest degradation drove a large share of the rise in emissions in 2024 (Emissions Gap Report 2025).
- Wood harvests: a 2023 study in Nature estimated that global wood harvests emit 3.5 to 4.2 billion tonnes of CO2e a year, much of which is not counted in national figures.
For the detail, read our main guide to agricultural greenhouse gas emissions and what percentage of emissions come from agriculture.
How much do transport and buildings contribute?
Transport produced 15% of global emissions in 2019, and buildings 6% directly, or 16% once their electricity and heat are counted (IPCC AR6 WGIII).
- Road transport is most of the transport total. Cars, vans and trucks still mostly burn petrol and diesel.
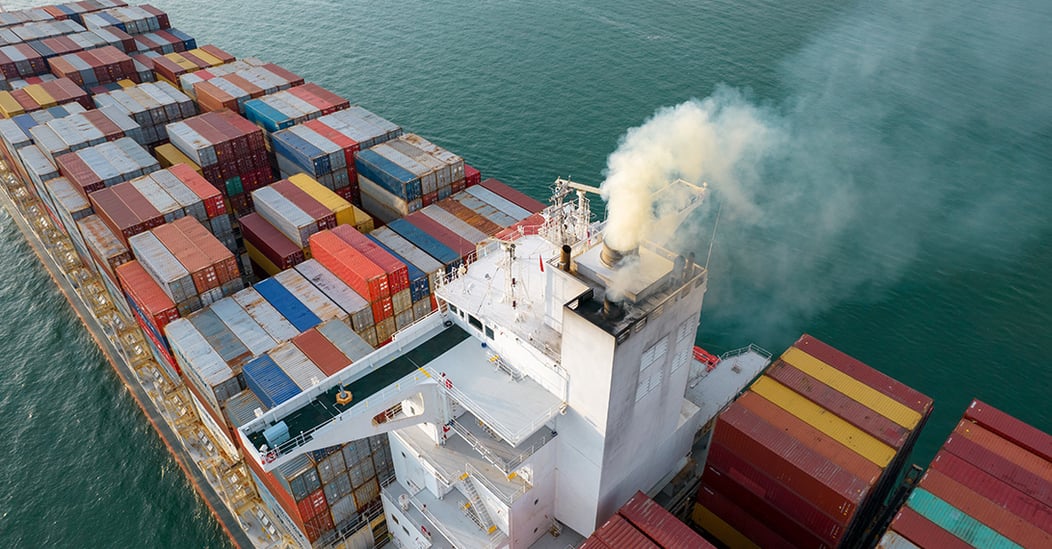
- Shipping produced about 2.9% of global human-caused emissions in 2018, according to the Fourth IMO GHG Study (IMO, 2020).
- Aviation emissions come mainly from jet fuel, plus non-CO2 effects at altitude.
- Buildings emit directly from gas and oil boilers and cooking, and indirectly from the electricity they use. Leaks of refrigerant gases from cooling also add to the total.
What does the sector breakdown mean for a company?
The global split tells you where emissions sit in the economy, not in your business. Most companies emit little themselves. Their footprint sits in what they buy (energy, materials, farm products) and what happens to what they sell.
A food company, for example, may have small Scope 1 and 2 emissions but a large agricultural Scope 3 footprint. A machinery maker's largest share is often the energy its products use once they are sold. That's why measuring your own Scope 3 emissions matters more than global averages.
Carbon prices also follow the sector split. Most carbon taxes and trading schemes start with power and heavy industry. See carbon pricing and its role in reducing CO2e.
Terrascope customer example: emissions are concentrated
Within a single company, emissions are usually concentrated in a few activities. When Princes Group mapped its value chain with Terrascope, its top five activities accounted for more than 60% of its emissions. Read the Princes case study.
How Terrascope helps
Terrascope shows which sectors, suppliers and materials drive your footprint, so you can act on the few activities that matter most.
- Map the hotspots: the Terrascope carbon footprint platform breaks emissions down by scope, category, site, supplier and material.
- Work with suppliers: Scope 3 supplier engagement helps you collect supplier data and replace spend-based estimates with real figures.
- Start with a map: the value chain mapping workshop helps your team find the activities that drive your footprint.
For the full method, read our main guide on how to calculate GHG emissions. To find your own hotspots, talk to our team.
Be the first to know.
Join us on LinkedIn to get curated updates monthly.
FAQs
What is the largest source of greenhouse gas emissions?
Burning fossil fuels for energy is the largest source. It covers electricity, heat, industry, transport and buildings, and makes up about three-quarters of global emissions. Energy supply alone, mostly power stations, was 34% in 2019, according to the IPCC.
What percentage of emissions comes from agriculture?
Agriculture, forestry and other land use produced about 22% of global greenhouse gas emissions in 2019, according to the IPCC's Sixth Assessment Report. This includes livestock, fertiliser, rice and deforestation.
How much of global emissions comes from transport?
Transport produced about 15% of global greenhouse gas emissions in 2019, according to the IPCC. Road vehicles make up most of this. Shipping was about 2.9% of the global total in 2018, according to the IMO.
Which industry emits the most CO2?
Within industry, steel and cement are the largest CO2 sources, followed by chemicals. Cement is unusual because much of its CO2 comes from the chemical reaction that makes clinker, not just from fuel.
Are buildings a big source of emissions?
Directly, buildings produced about 6% of emissions in 2019. Once the electricity and heat they use is counted, the share rises to about 16%, according to the IPCC. Heating, cooling and appliances drive most of it.
Why does the sector split vary between sources?
Sources group emissions differently. Some count power-station emissions under "energy", while others assign them to the industry, building or transport that uses the electricity. Years and gas coverage also differ. Always check the source and year.