Summary
-
Emissions data can pass assurance early: Dyno Nobel’s first global audit covered 1.6 million tonnes of Scope 1 and 2 emissions on five continents, a year before Australia’s deadline.
-
Fewer, more automated emission factor sources saved time and delivered a clearer audit trail. Sime cut 24 emission factor databases to 4, and maintenance fell to near zero.
-
Scope 3 is most of the footprint (over 98% at Ohmium, 99% at iNova Pharmaceuticals), so the biggest cuts sit in products, packaging and suppliers.
-
The data now pays its way: Sime reports a positive return on investment, Dyno Nobel’s product data gives it an edge with buyers, and Tetra Pak uses product footprints in customer conversations.
Your auditor wants evidence behind every emissions figure. Under Australia’s mandatory climate reporting rules, companies in scope need limited assurance over their Scope 1 and 2 emissions from their first report. Your customers want product footprints. Your site data arrives in spreadsheets, once or twice a year, from a dozen countries.
These five mining, industrial and manufacturing companies faced the same gap. Each one built an emissions baseline it could defend, found where most of its emissions sat, and acted on it.
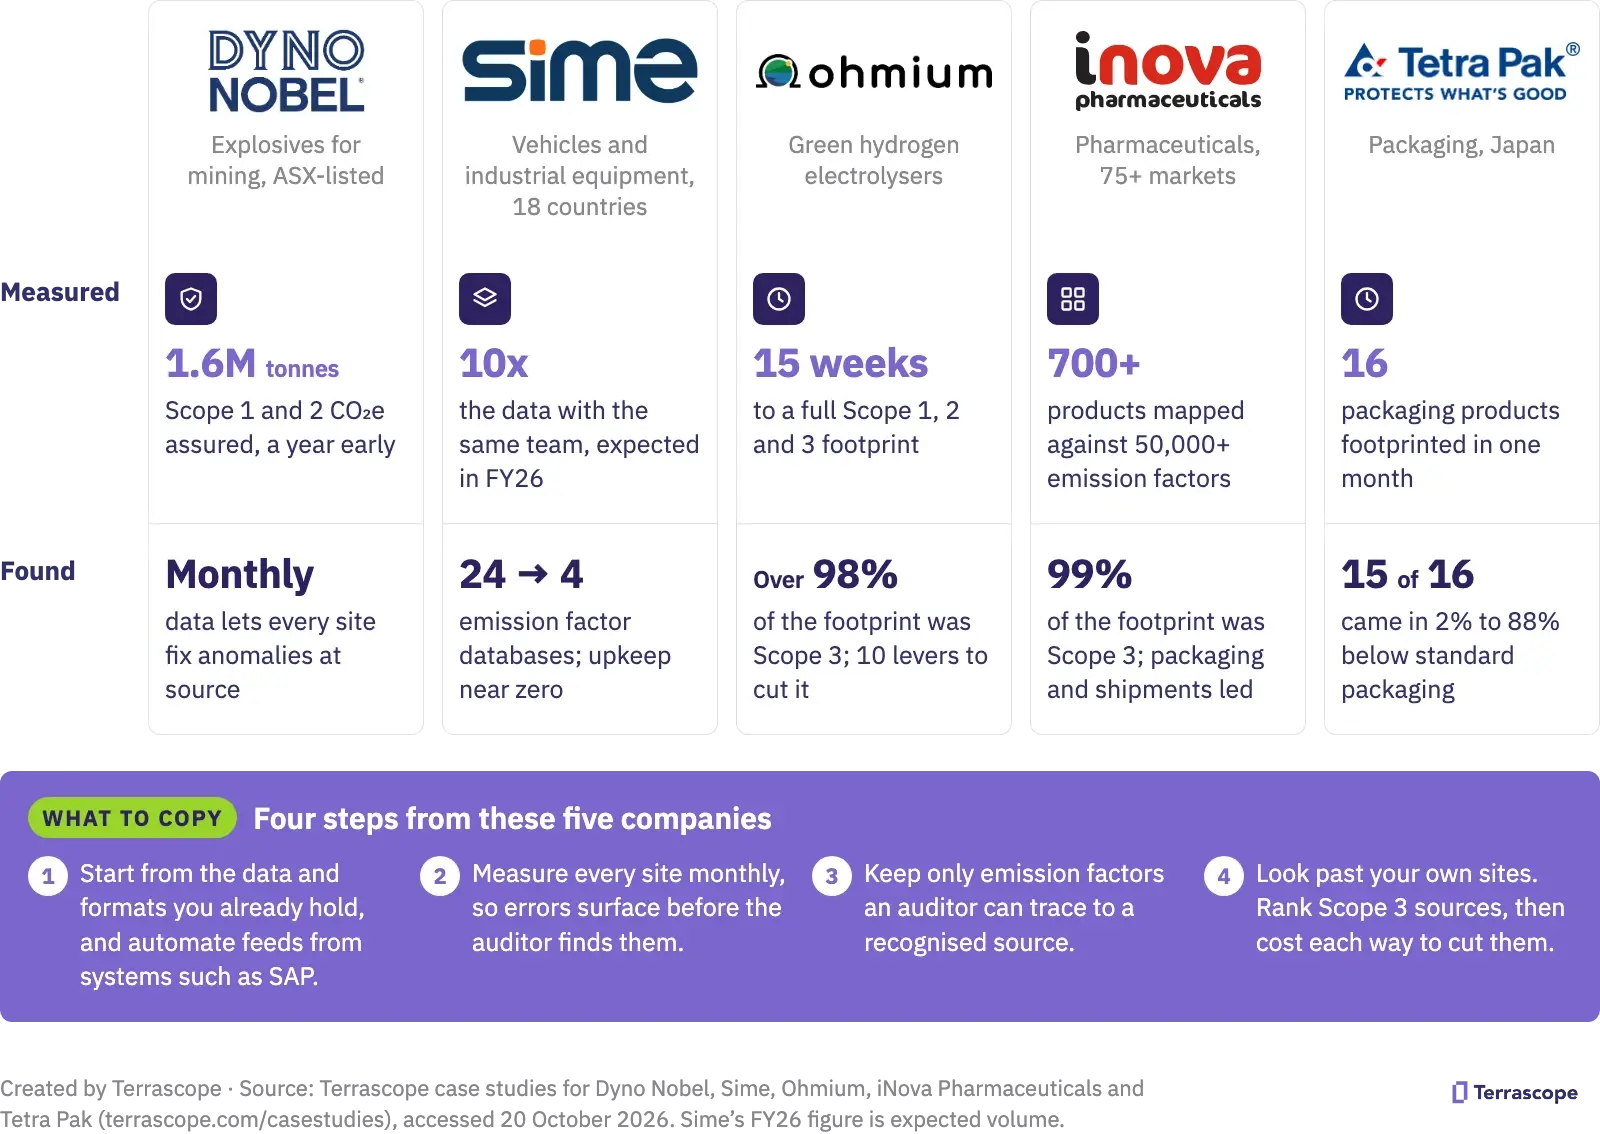
The five at a glance
Which example matches your situation?
- Mining or heavy industry with an assurance deadline → Dyno Nobel
- Hundreds of sites and a small sustainability team → Sime
- A first Scope 3 count and an SBTi target to support → Ohmium
- Many products made by contract manufacturers, plus packaging rules → iNova
- Customers asking how your packaging compares → Tetra Pak
Dyno Nobel passed a global emissions audit
Result: limited assurance over 1.6 million tonnes of global Scope 1 and 2 emissions in 2025, a full year ahead of the Australian Sustainability Reporting Standards (ASRS) deadline.
Business outcome: Dyno Nobel used the lead time to fix data quality issues. Its internal benchmarking shows its product-level emissions are typically lower than generic emission factors from ecoinvent, a widely used life cycle database, which gives it an edge with buyers trying to cut their own Scope 3. The audited data underpins its targets to cut Scope 1 and 2 emissions by 25% by 2030 and 50% by 2036, against a 2020 baseline.
Dyno Nobel, listed on the ASX, makes commercial explosives and blasting technology for mining, quarrying and construction, and employs more than 5,500 people.
- The problem: emissions sat in spreadsheets, and several international operations reported only once a year, so data problems surfaced long after they happened. Dyno Nobel needed figures its existing audit partner could assure.
- What Terrascope did: built upload templates that match Dyno Nobel’s own formats, which cut each upload to about 5 to 10 minutes per file, and automated integrations that push data from SAP and invoice-scanning services. Every site now reports Scope 1, 2 and 3 monthly into one corporate carbon footprint.
- What it found: monthly data lets international sites isolate anomalies at source and fix them before they compound.
- Quality check: limited assurance over global Scope 1 and 2 emissions in 2025. Dyno Nobel’s 2025 GRI Index credits its emission factors as retrieved via the Terrascope platform.
“The most significant achievement Terrascope helped us with was completing a global scope 1 and 2 limited assurance audit, something we’d never done before, using consolidated data from our operations across five continents including the Americas, Australia, Europe and Asia. We are extending this to limited assurance of global scope 3 and reasonable assurance of scope 1 & 2 in 2026.”
Karen Durand, General Manager Global Sustainability at Dyno Nobel
Read the Dyno Nobel case study
How Sime handled 10 times the data with the same team
Result: about 50,000 emissions data points expected in FY26, up from about 3,000 in FY25, with the same team effort.
Business outcome: Sime reports a positive return on investment, driven by stronger data quality, more confidence in its reported figures and insights that inform its decarbonisation work. The team now spends more time on decarbonisation strategy, and energy, waste and water dashboards give executive leadership a quarterly view.
Sime, listed on Bursa Malaysia, sells and services vehicles and industrial equipment from about 600 sites in 18 countries and territories.
- The problem: Sime reports under Australia’s National Greenhouse and Energy Reporting (NGER) scheme, Bursa Malaysia’s requirements and AASB S2. Its team calculated emissions in Excel, with emission factors drawn from 24 separate databases, and data processing took most of its time.
- What Terrascope did: worked with Sime to cut the 24 databases to four recognised sources, Australia’s National Greenhouse Accounts (NGA), IPCC, IEA and DEFRA, which Terrascope keeps updated. Standard templates in the corporate carbon footprint replaced bespoke spreadsheets, and the two companies built energy, waste and water dashboards together.
- What it found: many of the 24 databases overlapped and were hard to trace. Month-level data has now replaced half-year totals.
- Quality check: every emission factor now traces quickly to a recognised source, and locked emission factors keep year-on-year comparisons consistent.
“Terrascope has enabled us to consolidate, track and manage our GHG emissions in a more structured and consistent way.”
Angus Thompson, Executive Manager - Sustainability & Strategy, Sime
Read the Sime case study · Watch the Sime webinar
How Ohmium found 10 ways to cut its emissions
Result: a full Scope 1, 2 and 3 footprint in 15 weeks, and 10 high-impact ways to cut it.
Business outcome: Ohmium now has a transition plan that supports its Science Based Targets initiative (SBTi) submission. Staff who took part in the workshops backed the actions.
Ohmium, headquartered in the United States, designs, makes and deploys proton exchange membrane (PEM) electrolysers, which produce green hydrogen. It manufactures in India and has projects in more than 30 countries.
- The problem: Ohmium had measured Scope 1 and 2 in-house but had never measured Scope 3, and it wanted a decarbonisation plan.
- What Terrascope did: measured all three scopes in a corporate carbon footprint, then ran three workshops on SBTi frameworks and built a marginal abatement cost curve (MACC), a chart that ranks reduction options by cost and impact.
- What it found: Scope 1 and 2 were small, mostly fleet diesel and grid electricity. Scope 3 made up over 98% of the footprint. The plan covers fleet electrification and renewable electricity for its sites, then more efficient products, recycled materials and circular economy programmes for Scope 3.
“Terrascope made it easier for us to measure and understand our emissions. The platform and guidance enabled us to gather data more readily.”
Ashwin Varma, Chief Operations Officer, Ohmium
iNova Pharmaceuticals mapped emissions across 700+ products
Result: its first complete, audit-ready Scope 1, 2 and 3 baseline, for FY23, mapped across more than 700 products.
Business outcome: a cost-benefit model of options such as switching packaging and optimising transport lets iNova Pharmaceuticals weigh return on investment alongside emissions. It met packaging reporting rules in Singapore, Vietnam and Australia and is now assessing new packaging formats and logistics with a priority group of suppliers.
iNova Pharmaceuticals, headquartered in Singapore, sells over 1,100 products in more than 75 markets, made by third-party manufacturers.
- The problem: spend-based estimates, which convert money spent into emissions, could not show which products or suppliers drove the footprint. iNova also had to report packaging data under Extended Producer Responsibility (EPR) rules in several countries.
- What Terrascope did: used AI to match activity data to more than 50,000 emission factors and estimate a product carbon footprint for each product. With its partner Ricardo, it prepared iNova’s packaging data for EPR reporting.
- What it found: Scope 3 made up 99% of the footprint, in line with pharmaceutical peers. Packaging was a key source, and specific shipments also stood out.
- Quality check: the modelled estimates follow recognised carbon accounting standards and form an audit-ready baseline.
“Terrascope made it easy for our team to understand our emissions footprint and how we stacked up against industry peers. Their insights helped us focus on what really matters.”
Paul Smith, Chief Operations Officer, iNova Pharmaceuticals
How Tetra Pak Japan footprinted 16 packaging products in a month
Result: product carbon footprints for 16 products in one month. Fifteen came in between 2% and 88% below industry-standard packaging.
Business outcome: Tetra Pak uses verifiable product-level data in conversations with prospects and customers, which helps it attract new customers and strengthen relationships with existing ones.
Tetra Pak makes food processing and packaging solutions used in more than 160 countries. This project was with its business in Japan.
- The problem: packaging life cycle assessments (LCAs) were slow and costly. A traditional LCA typically takes several months for a single product.
- What Terrascope did: estimated a cradle-to-gate product carbon footprint for each product, even without primary data, and benchmarked each one against alternative packaging.
- What it found: the analysis also quantified the reductions available from using more bioplastics, which will guide product development.
Read the Tetra Pak case study · Watch the Tetra Pak video
Get audit-ready emissions data in weeks
Terrascope pairs the platform with climate and carbon experts who work with your team from data collection to targets and assurance.
- Corporate Carbon Footprint: Scope 1, 2 and 3 in one inventory, measured as often as monthly
- Data Management: automated integrations and validation that keep site data audit-ready
- Product Carbon Footprint: a footprint for every product, built from data you already hold
- Decarbonise with AI: plan and track reduction work with your business and operations teams
Further reading
- Australia’s climate disclosure rules: what you need to know
- A guide to your first climate audit
- Behind the numbers: understanding emission factors
- UK climate disclosure rules: what you need to know
FAQs
Sources: Terrascope case studies for Dyno Nobel, Sime, Ohmium, iNova Pharmaceuticals and Tetra Pak (terrascope.com/casestudies). Australian assurance phasing per ASSA 5010, as summarised in Terrascope’s guide to Australia’s climate disclosure rules.