
Summary
Data transparency in Scope 3 reporting means showing where your numbers come from: the methods, emission factors, data sources, assumptions and data quality behind each figure. It matters because Scope 3 relies on estimates. Transparent reporting lets auditors, investors and customers trust your figures, helps you avoid greenwashing claims, and shows where to improve data next.
What does data transparency mean for Scope 3?
It means anyone reading your Scope 3 figures can see how they were built. Scope 3 covers emissions in your value chain, so much of it is estimated from supplier data, industry averages and spend. Transparency is about being open on which is which.
The GHG Protocol Scope 3 Standard already asks companies to disclose, for each category, the methods and emission factors used, the share of data from suppliers, and any exclusions with reasons. For the basics, see our main guide to Scope 3 emissions.
| A transparent Scope 3 report shows | Why it matters |
| The calculation method for each category | Spend-based and supplier-specific results can differ a lot |
| Emission factor sources and years | Lets readers judge whether factors are current and relevant |
| Share of primary (supplier) data | Shows how much is measured versus estimated |
| Categories excluded, with reasons | Shows the inventory is complete, or where it isn't |
| Base year and any recalculations | Explains changes that aren't real reductions |
| Data quality assessment | Shows where figures are weak and improving |
Why is data transparency important in Scope 3 reporting?
Because Scope 3 is mostly estimated, readers need to see the method to trust the result. There are four main reasons.
Disclosure rules and assurance require it
More rules now require Scope 3, and auditors must be able to follow every number. IFRS S2, Australia's AASB S2 and California's SB 253 require Scope 3 after transition periods. Under the EU CSRD, Scope 3 is reported where material. Several regimes, including Australia's, phase in external assurance of emissions figures. Auditors will ask for the data trail behind each figure. See our guide to Australia's mandatory climate reporting and the sustainability reporting rules explainer.
It protects against greenwashing claims
Unclear or overstated emissions claims carry legal and reputational risk. In the EU, the Empowering Consumers for the Green Transition Directive (Directive (EU) 2024/825) bans generic environmental claims that can't be proven, and claims that a product has a neutral or reduced climate impact based on offsetting. Member states must apply it from 27 September 2026. Clear Scope 3 data and methods are the evidence behind any product or company claim.
It leads to better decisions
Transparent data shows where emissions really sit, and how confident you can be in each figure. That helps you choose which suppliers, materials and products to work on, and which data to improve first. It also shows whether changes year to year are real reductions or just method changes.
It builds trust with investors, lenders and customers
Investors use Scope 3 data to judge transition risk. Lenders tie sustainability-linked finance to emissions targets. Customers use your figures in their own Scope 3. All of them need to know how reliable your numbers are. Transparent reporting also makes it easier to compare companies in high-emitting sectors such as forest, land and agriculture (FLAG).
What makes Scope 3 transparency hard?
Two things: complex value chains and patchy data from suppliers.
- Complex value chains. Large companies have many suppliers, contractors and business units. Each may report in different formats, units and boundaries, which makes it hard to combine data.
- Patchy external data. Many suppliers don't measure emissions or lack the resources to. Where data is missing, companies use industry averages and spend-based estimates. Our guide to Scope 3 calculation methods explains the trade-offs.
Neither problem is a reason not to report. The answer is to say clearly which figures are estimated and how you plan to improve them.
How can you make Scope 3 reporting more transparent?
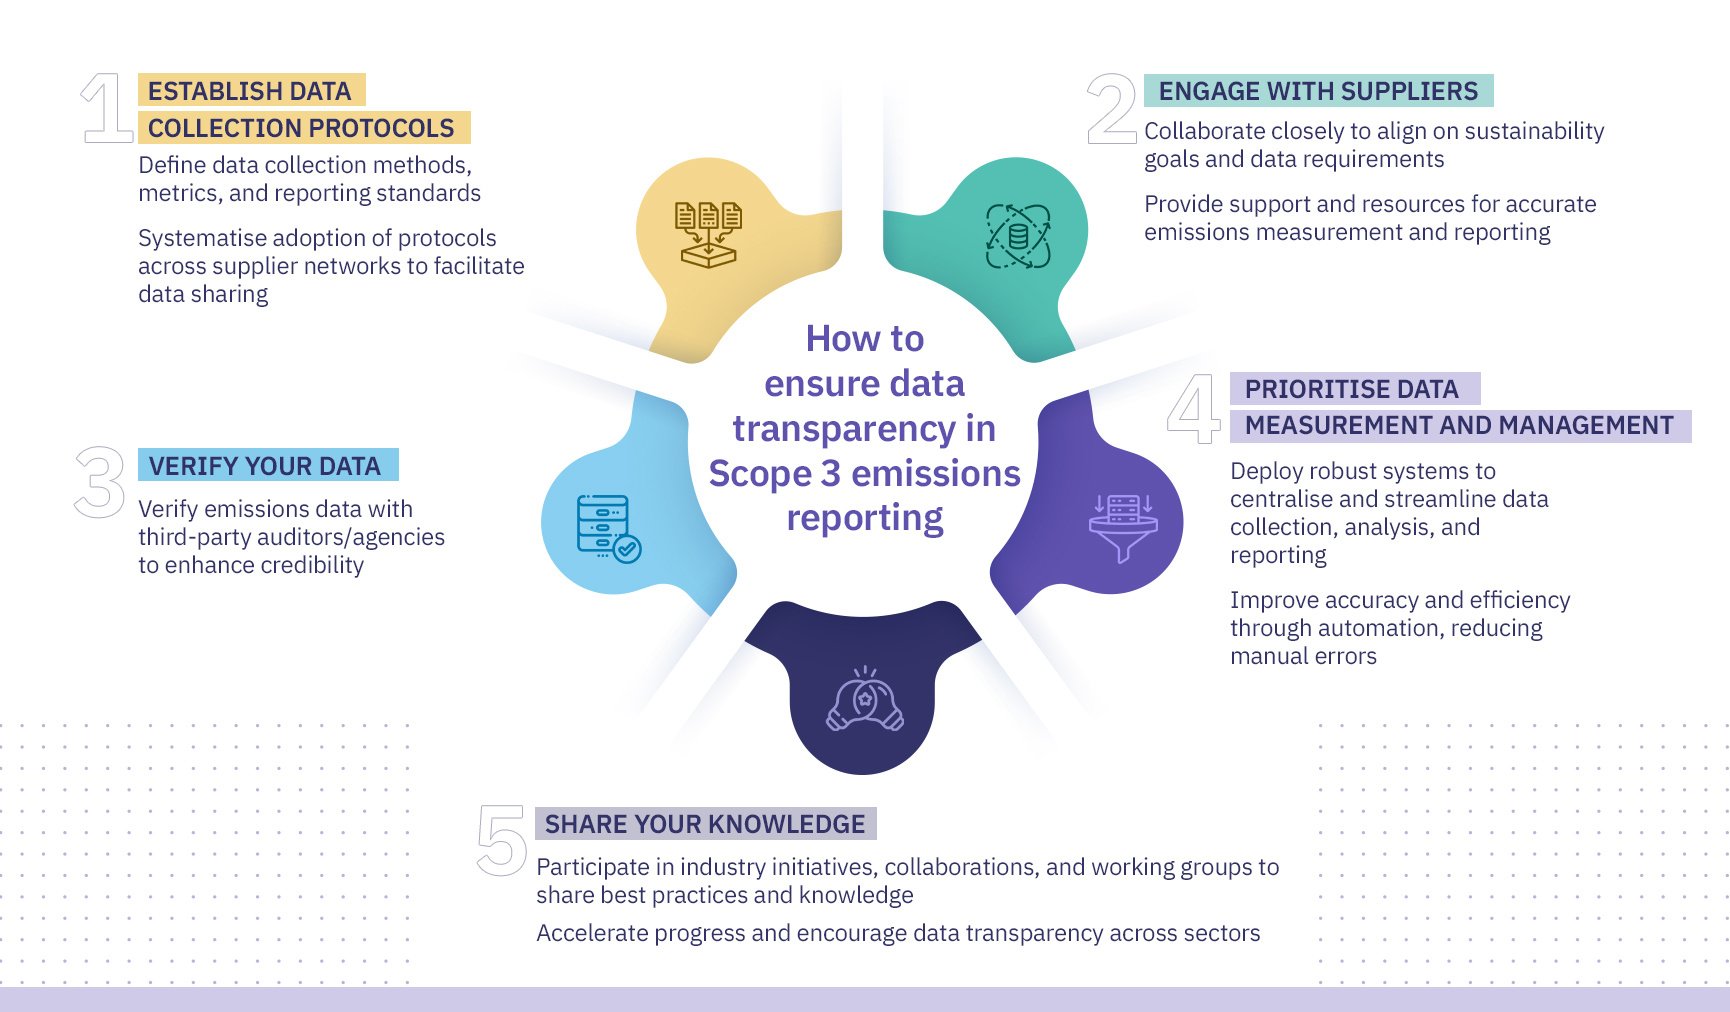
Follow five practices.
- Set clear data collection rules. Define methods, metrics, units and boundaries across the business, and share a standard template with suppliers.
- Engage suppliers. Agree data requirements with key suppliers and help them measure. See Scope 3 supplier engagement.
- Score data quality. The GHG Protocol Scope 3 Standard suggests rating data on technology, time, geography, completeness and reliability. Record a score for each major figure.
- Get it verified. Independent assurance adds credibility, and is becoming required in several markets. Keep a full audit trail from source data to reported figure.
- Use one system of record. Centralise data, calculations and emission factor choices so you can explain every number and every change between years.
What does this look like in practice?
Dyno Nobel worked with Terrascope and had 1.6 million tCO2e of emissions externally assured. A clear data trail from source to figure is what makes that kind of assurance possible.
How Terrascope supports transparent Scope 3 reporting
Terrascope is built so you can explain every figure in your Scope 3 inventory:
- Data profiling: highlights gaps in data quality, coverage and granularity, so you know where to collect better data.
- Carbon driver tree: shows the activities, boundaries and categories behind your emissions, including FLAG and non-FLAG splits.
- Audit trail: links each reported figure back to its source data, method and emission factor, using Terrascope data management.
- Year-on-year explanations: shows what drove changes between years, such as new data, better coverage or different emission factors.
- Reporting: exports disclosures in the formats needed for frameworks such as IFRS S2 and CSRD through Terrascope climate reporting.
- Supplier data: collects primary data from suppliers through Scope 3 supplier engagement.
To see where your Scope 3 data is weakest before your next report, book a free value chain mapping workshop.
Frequently asked questions
What is data transparency in emissions reporting?
It is disclosing how your emissions figures were calculated: the methods, emission factors, data sources, assumptions, exclusions and data quality. It lets readers judge how reliable each number is.
Why does Scope 3 need more transparency than Scope 1 and 2?
Because most Scope 3 data comes from outside the company and is often estimated. Without knowing the method and data quality, readers can't tell how reliable a Scope 3 figure is.
What should a Scope 3 report disclose?
For each category: the emissions, the method and emission factors used, the share of supplier data, and any exclusions with reasons. Also the base year and any recalculations. These follow the GHG Protocol Scope 3 Standard.
Does Scope 3 data need external assurance?
In some markets it will. Several regimes are phasing in assurance of emissions figures, starting with Scope 1 and 2. Even where it isn't required, assurance adds credibility for investors and customers.
Can poor Scope 3 data lead to greenwashing?
Yes. Overstated or unclear claims based on weak data can be seen as greenwashing. In the EU, Directive (EU) 2024/825 bans generic environmental claims that can't be proven, from 27 September 2026.
Talk to us about Scope 3 reporting
If you're preparing Scope 3 for a disclosure or assurance, contact our team.